Candlestick, Line charts, the ultimate GUIDE for BEGINNERS Challenge 5th Week
This is the 5th week of the trading journey I started to help beginners trade SPY options with $2000 USD. Candlestick charts are more used in trading for various reasons. In this video, you learn the fundamentals about Candlestick charts and Line charts.
It takes a huge amount of time to do the research and make videos.
If you want to support the channel, then feel free to send something here:
CashApp: $gamerising4K
0:00 Intro
2:11 US debt ceiling talks on must be added a monthly calendar
2:50 My calendar for May 2023
3:17 Setting stop loss on Robinhood
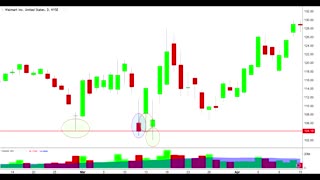
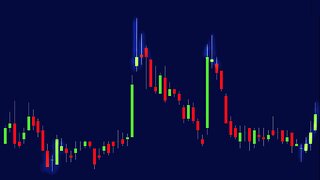
5:34 Candlestick and line charts
10:05 Some example of line charts
10:54 Previous trades
11:39 Quick recap
Please like the video, subscribe and share your thoughts so I can make better quality videos:)
#financialsuccess #mindset
---------------------------------------------------------------------------------------------------------------------
Offer will end soon. Get 2 FREE STOCKS Worth Up To $1600 on WeBull when you deposit $100:
https://a.webull.com/8ksCFaph5HzWoM54q0
---------------------------------------------------------------------------------------------------------------------
Follow me on Instagram: https://www.instagram.com/hpthefinanc...
---------------------------------------------------------------------------------------------------------------------
https://uppbeat.io/t/soundroll/tropicana
License code: YDOLJT5L836CME41
-
 1:06
1:06
Ascencore
6 months agoCandlestick Charting Patterns: Tips And Practice Project
25 -
 5:27
5:27
Ascencore
7 months agoThe Basics Of How To Read Candlestick Patterns On Charts
15 -
 2:12
2:12
Ascencore
7 months agoIntroduction To Candlestick Pattern Charting
18 -
 2:51
2:51
Ascencore
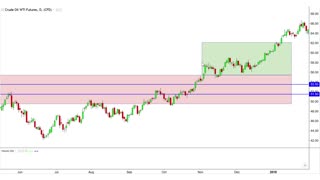
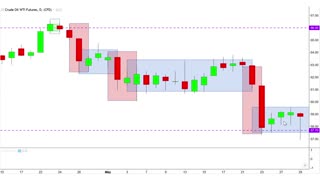
6 months agoCandlestick Charting Pattern (Practice Case Study) Crude Oil Futures Chart
15 -
 6:23
6:23
Ascencore
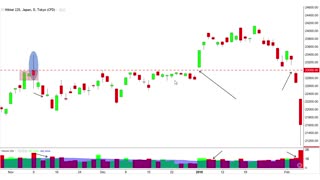
6 months agoPractice Candlestick Chart Patterns: Case Study Example Nikkei
24 -
 3:27
3:27
Ascencore
7 months agoThe Most Important Candlestick Charting Proportions
4 -
 3:51
3:51
Ascencore
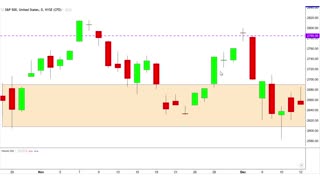
6 months agoPractice Candlestick Charting With A Case Study Of The SPX Chart
20 -
 6:17
6:17
Ascencore
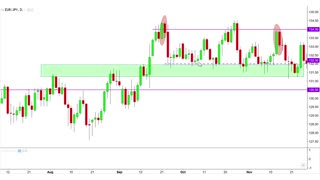
7 months agoEasy Candlestick Charting Pattern Analysis: (Harami) Example Case Study With EURJPY Chart
5 -
 10:25
10:25
Ascencore
7 months agoSimple Candlestick Charting With Two Candle Reversal Patterns (Example Case Study (CADUSD Chart))
17 -
 4:40
4:40
Ascencore
7 months ago(Continuation) Candlestick Charting Pattern Analysis: Example Case Study Crude Oil Futures Chart
15