
5 Design Tips for Better Excel Reports & Dashboards
May 19, 2017 Excel Dashboards & Reports
I take you through 5 design tips that help create better Excel Reports and Dashboards.
Link to Excel Dashboard course: https://courses.xelplus.com/p/professional-excel-dashboards
Full article is here: https://www.xelplus.com/5-design-tips-for-excel-dashboards-reports/
5 tips to create the best Excel dashboard:
1. Create emphasis: Add a strong contrast to headings to show at a glance the KPIs on display in your Excel dashboard.
2. Connect different elements: Show relationships with alignment.
3. Draw parallels and create associations: Two things that should be repeated consistently in your dashboard are abbreviations and color usage.
4. Organise content and create focal points: Think about proximity. What will you choose to group or separate?
5. Balance large elements with smaller elements
★ My Online Excel Courses ► https://courses.xelplus.com/
✉ Subscribe & get my TOP 10 Excel formulas e-book for free
https://www.xelplus.com/free-ebook/
EXCEL RESOURCES I Recommend: https://www.xelplus.com/resources/
Get Office 365: https://microsoft.msafflnk.net/15OEg
Microsoft Surface: https://microsoft.msafflnk.net/c/1327040/451518/7593
GEAR
Screen recorder: http://techsmith.pxf.io/c/1252781/347799/5161
Main Camera: https://amzn.to/3a5ldBs
Backup Camera: https://amzn.to/2FLiFho
Main Lens: https://amzn.to/39apgeD
Zoom Lens: https://amzn.to/3bd5pN7
Audio Recorder: https://amzn.to/2Uo5rLm
Microphone: https://amzn.to/2xYy9em
Lights: http://amzn.to/2eJKg1U
More resources on my Amazon page: https://www.amazon.com/shop/leilagharani
Let’s connect on social:
Instagram: https://www.instagram.com/lgharani
Twitter: https://twitter.com/leilagharani
LinkedIn: https://at.linkedin.com/in/leilagharani
Note: This description contains affiliate links, which means at no additional cost to you, we will receive a small commission if you make a purchase using the links. This helps support the channel and allows us to continue to make videos like this. Thank you for your support!
#MsExcel
-
 14:14
14:14
humulica
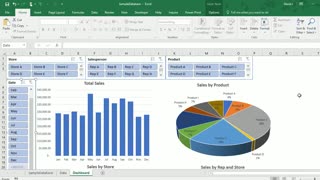
2 years agoHow to Create Dashboards in Excel
45 -
 4:53
4:53
Latest News From CFP and INFOWARS
3 years agoBetter Living Through Better Design
3 -
 42:36
42:36
RahimZulfiqarAli
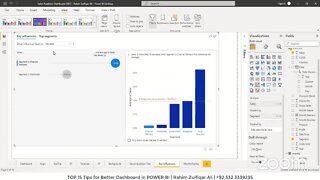
2 years ago15 Microsoft POWER BI Tips for Better Dashboards
-
 5:12
5:12
pjglassey
2 years agoMan-made immunity VS God's design - which is better?
1 -
 17:29
17:29
RahimZulfiqarAli
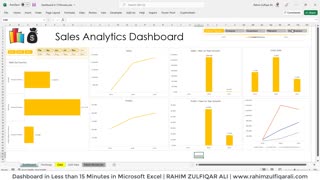
2 years agoExcel Dashboards in Under 15 Minutes! Awesome Secret Tips & Tricks
3 -
 0:27
0:27
Hireheroes
2 years agoWebsite Design Tips! #shorts
-
 1:47
1:47
southbaychiro
2 years ago5 Tips for Better Sleep
24 -
 0:59
0:59
animals & cartoon
2 years agoexcel tricks,excel tips and tricks,excel
15 -
 1:25:38
Kim Iversen
3 hours agoTrump’s Nigeria Threat Isn’t About Christians — It’s About China
76K68 -
 LIVE
LIVE
VikingNilsen
6 hours ago🔴LIVE - ARC RAIDERS - QUEST GRINDING
9 watching