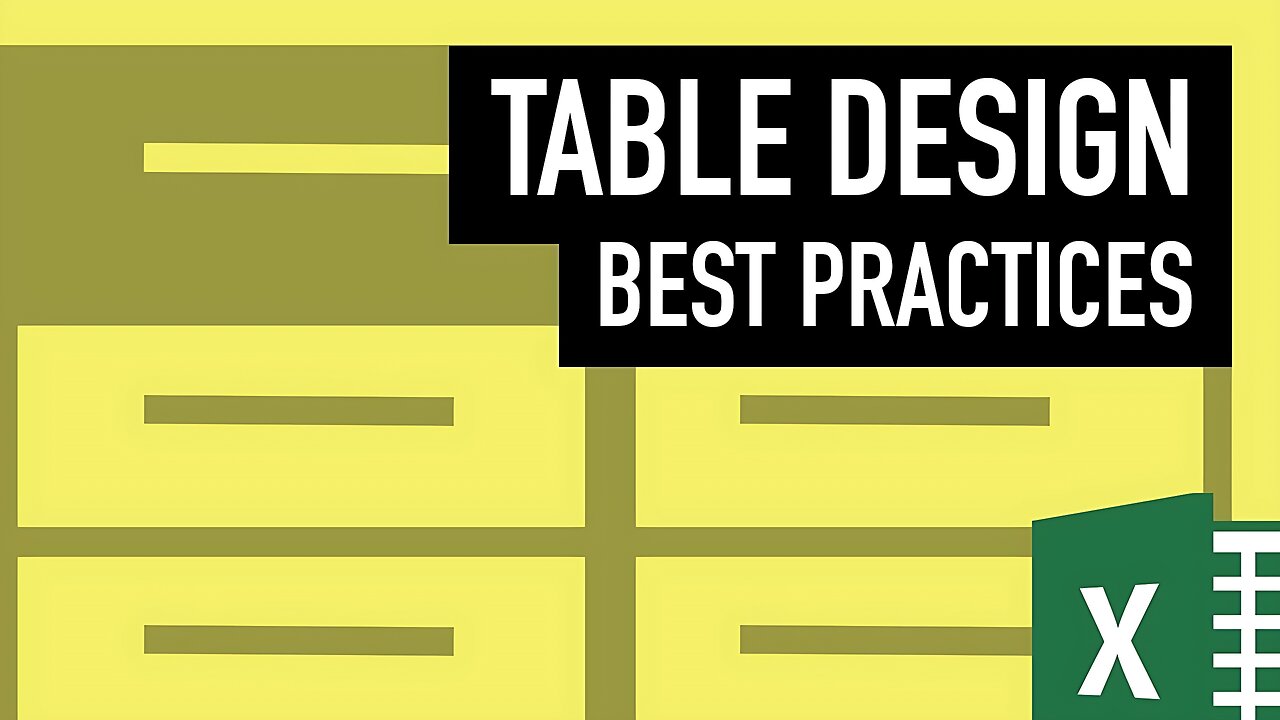
Excel Tables: Best Practice to Create Tables for Financial Reporting in Excel
Sep 23, 2016 Excel Charts
Complete Advanced Excel Chart Course: https://courses.xelplus.com/
Excel Tables: Best Practice to Create Tables for Reporting in Excel Summary:
Use Excel data tables when you’d like the reader to lookup individual values and do exact one to one comparisons. Follow these best practices for optimum data table design in Excel:
1. Organize – arrange your categories into groups whenever it makes sense. Items should have a clear sequence. If you're not sure, put yourself in your readers shoes. If you have ratios presented, these should come right after your variables that feed the ratio. If you are showing aggregated values, you should visually separate this from the rest of the data by either adding borders or color to distinguish it from the rest.
2. Focus on data – Keep the focus on your data by keeping the table borders and grids very subtle. Or simply use white space for the grids between data. Use very subtle fill color to assist the reader with horizontal scanning of values for larger data tables.
3. Formatting – Numbers should be right aligned. This way the reader can compare the values with more ease than when they are centered or left aligned. Text on the other hand should generally be left-aligned. Sometimes though when the text is short, you might prefer to center or right align it to fit your table better – so use your judgment here. How you present large numbers, negative and positive values really depend on your country and the organization you work for – i.e. what your readers are used to seeing. Text font should be easy to read, such as Arial or Verdana.
4. Emphasis – If you’d like to bring the readers attention to a certain number, you can use color or change it’s format to bold. If you’d like to bring the attention to a certain section of the table, especially when doing comparisons between one scenario to another, such as budget against actual, you can use symbols.
Find more videos on charts here:
https://youtu.be/9y2OubgWhpE
https://youtu.be/cYHOezDL8SQ
https://youtu.be/FPxCKs4OlWE
https://youtu.be/5nf8rucx80E
★ My Online Excel Courses ► https://courses.xelplus.com/
✉ Subscribe & get my TOP 10 Excel formulas e-book for free
https://www.xelplus.com/free-ebook/
EXCEL RESOURCES I Recommend: https://www.xelplus.com/resources/
-
 LIVE
LIVE
SpartakusLIVE
12 hours agoTOXIC Solos on ARC Raiders || Friday Night HYPE - WZ or Redsec Later?
960 watching -
 2:15:42
TheSaltyCracker
5 hours agoWoke is DEAD ReeEEStream 11-07-25
100K170 -
 1:29:13
Sarah Westall
4 hours agoThe City of London: Infiltration, Intimidation & Centralized Power w/ Mike Harris
29.1K10 -
 10:14:18
Dr Disrespect
14 hours ago🔴LIVE - DR DISRESPECT - ARC RAIDERS - AGAINST ALL DANGER
185K25 -
 32:09
32:09
ThisIsDeLaCruz
1 day ago $0.83 earnedFalling In Reverse: Christian Thompson’s Stage Tech Revealed
25.4K3 -
 LIVE
LIVE
SynthTrax & DJ Cheezus Livestreams
1 day agoFriday Night Synthwave 80s 90s Electronica and more DJ MIX Livestream 80s Night / Late Night Nostalgia
400 watching -
 4:05:52
Nerdrotic
9 hours ago $12.64 earnedHollywood REGRET | Disney's Predator | The Feminist Avengers - Friday Night Tights 379
61.7K17 -
 2:36:22
Mally_Mouse
4 days agoFriend Friday!! 🎉 - Let's Play! - MIMESIS
29.6K3 -
 41:20
41:20
MattMorseTV
6 hours ago $21.93 earned🔴Schumer just BACKSTABBED his OWN VOTERS. 🔴
37.2K74 -
 3:33:34
MissesMaam
6 hours ago*Spicy* Friend Friday with Mally_Mouse!! 💚✨
13.4K3