Premium Only Content

From Chaos to Clarity: Mastering the Totals Query in Access
In this video, I tackle a common challenge that most of us face in the corporate world: how to present a complex set of data in a concise and understandable format. The specific problem I address is when you're asked to create a report that not only provides a detailed breakdown of sales by individual products but also a total per region. This might sound daunting at first, but with the right tools and approach, it's a breeze.
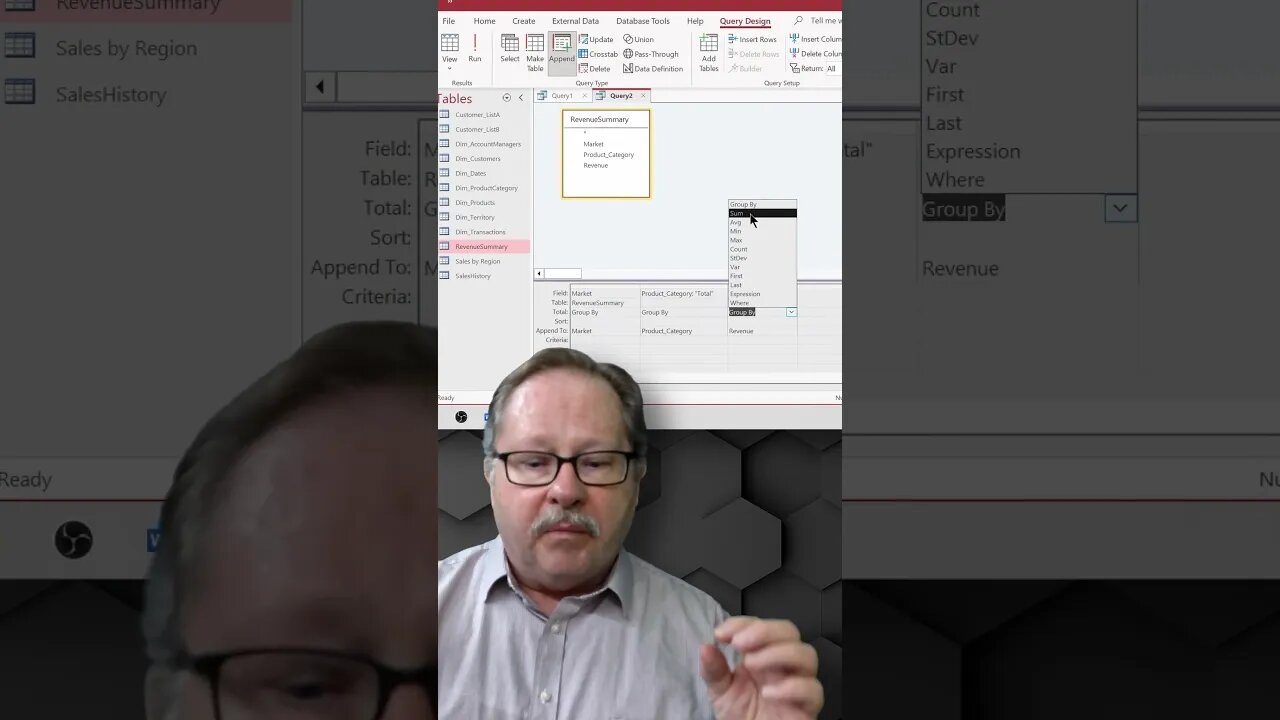
I walk you through how to use a totals query to segregate and total different product categories. We then use a 'make table' query to put this data into a new table, which we call 'Revenue Summary'. To give an even clearer picture, I show how to total everything up to the market level and append it to the other data. The end result is a comprehensive 'Revenue Summary' table with a total column, subtotals by product category, and all the data that would make your boss happy.
Keywords: Totals query, Make table query, Microsoft Access, Revenue Summary, Report creation, Data breakdown, Product category, Region totals.
See my other channels:
Current news on the economy and economic concepts:
https://www.youtube.com/@doctorecon
Current thoughts on leadership topics:
https://www.youtube.com/@pharosleadership
Blockchain and Cryptocurrency News:
https://www.youtube.com/@pharosblockchain
-
 4:57
4:57
Pharos Technology
1 year agoHow to Properly Format Cells in Excel: A Beginner's Guide
18 -
 59:49
59:49
The StoneZONE with Roger Stone
6 hours agoUpdate on Andrew & Tristan Tate w/ Lawyer Joe McBride +What will Trump do about J6ers? The StoneZONE
95K15 -
 1:08:56
Man in America
10 hours ago🔴 LIVE: California Wildfires—APOCALYPTIC Warning or Globalist Land Grab?
37.9K17 -
 1:30:04
Donald Trump Jr.
12 hours agoFires Rage Across LA, How Dems Destroyed the Golden state, Live with Alex Marlow, John Phillips, and Joe Bastardi | TRIGGERED Ep.206
135K246 -
 1:37:52
Glenn Greenwald
9 hours agoInternational Rage—From EU To Brazil—Over Zuckerberg’s Vow To End Censorship; Lee Fang On Financial Interests Behind H1B & LA Mayor Skipping Town | SYSTEM UPDATE #386
79.1K54 -
 58:44
58:44
Flyover Conservatives
1 day agoInauguration Danger: Is Trump Walking Into a Trap? - Sheriff Richard Mack | FOC Show
28.7K12 -
 1:48:50
Precision Rifle Network
1 day agoS4E1 - Guns & Grub - Back like a bad rash!
37.7K3 -
 1:11:22
Common Threads
7 hours ago $3.49 earnedLIVE DEBATE: Trump Pushes U.S. Expansion, Cali Fires Spark Political Outrage
53K6 -
 54:46
54:46
LFA TV
11 hours agoThe LA Apocalypse | TRUMPET DAILY 1.9.25 7pm
45.7K20 -
 57:50
57:50
theDaily302
16 hours agoThe Daily 302-CORY GAUTEREAUX
50.2K