Section 4 : How to create effective and appealing consumer report pt 15
2 years ago
1
As part of my learning's business series from @ZeroToMastery
Recap Charts to used in a report :
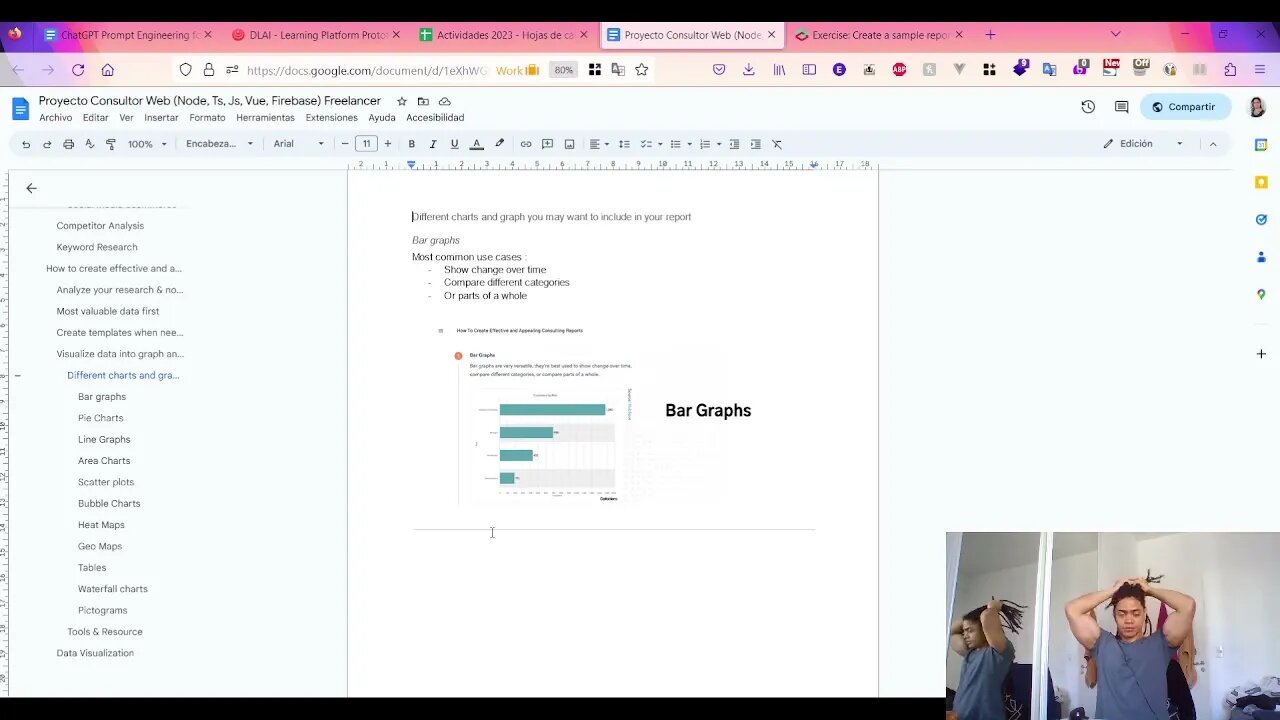
- Bar graphs
- Pie charts
- Line graph
- Area charts
- Scatter plot
- Bubble chart
- Heatmap
- Waterfall chart
- Data tables
- Pictograms
Source: https://www.linkedin.com/company/datahero/
Course :💼 https://zerotomastery.io/courses/learn-freelance-consulting
Loading comments...
-
 LIVE
LIVE
SpartakusLIVE
2 hours ago#1 King of Content leaves your Monday UTTERLY MOTIVATED
364 watching -
 LIVE
LIVE
RiftTV
2 hours agoFBI Director Kash Patel Sues Elijah Schaffer for $5 MILLION?!
1,018 watching -
 LIVE
LIVE
Blabs Games
9 hours agoLet's Get Those 5 Stars! Jurassic World Evolution 3 Playthrough #7
159 watching -
 50:26
50:26
BonginoReport
8 hours agoElections Post-Mortem with Mayor Scott Singer - Nightly Scroll w/ Hayley Caronia (Ep.174)
66.2K19 -
 LIVE
LIVE
XDDX_HiTower
41 minutes agoARC RAIDERS, FIRST DROP IN
44 watching -
 LIVE
LIVE
Eternal_Spartan
10 hours ago🟢 Eternal Spartan Plays Resident Evil 8 | USMC Veteran
38 watching -
 45:54
45:54
Donald Trump Jr.
5 hours agoGood Luck Chuck! The Left Lashes Out Over Shutdown Scheme's Failure | Triggered Ep.290
98.5K72 -
 LIVE
LIVE
Fragniac
2 hours ago🔵🟢🟡🔴 LIVE - FRAGNIAC - ARC RAIDERS - in Search of THE CLIP ( -_•)▄︻テحكـ━一💥
35 watching -
 LIVE
LIVE
The Jimmy Dore Show
3 hours agoDems CAVE On Gov’t Shutdown — Or Do They? Trump GASLIGHTS About Rising Food Prices! w/ Nick Cruse
7,346 watching -
 LIVE
LIVE
BIG NEM
7 hours agoDajana Gudic: Surviving the Bosnian War to Woke California
57 watching