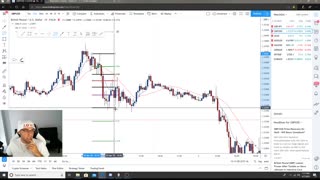
Daniel Savage Forex Trading Course: How I draw My FIBS
1 year ago
10
In this video of the Daniel Savage Forex Trading Course, Daniel provides an in-depth tutorial on how he draws his Fibonacci retracement levels on a price chart. He explains the key considerations that he takes into account, such as identifying significant highs and lows, determining the correct direction of the trend, and selecting appropriate anchor points for the Fibonacci tool. By following his step-by-step approach, traders can gain a clear understanding of how to use Fibonacci retracements as a powerful tool for analyzing price movements and identifying potential support and resistance levels in the forex market.
Loading comments...
-
 19:47
19:47
Forex Home
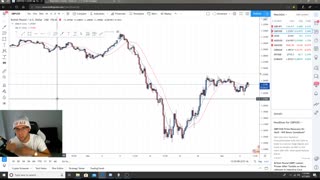
1 year agoDaniel Savage Forex Trading Courses: How I Draw My Fibs Part 2
2 -
 16:15
16:15
Forex Home
1 year agoDaniel Savage Forex Trading Course: How I Draw My Fibs Part 3
5 -
 15:32
15:32
114trading
8 months ago $0.02 earnedThe Ultimate Forex Course FREE - Lesson 2: Trading is GAMBLING
31 -
 8:28
8:28
114trading
8 months agoThe Ultimate Forex Course FREE - Lesson 1 What is trading
30 -
 1:13:34
AlphaOneYoutube
1 year agoForex Trading For Beginners Full Course 2022
2 -
 1:14:33
UPW CAPITAL
3 years agoFOREX Trading Setups with Detailed Technical Analysis (April 2021)
1 -
 6:59
6:59
AIFortunebuilder
5 months agoForex Trading Simplified: Master the Basics and Beyond
30 -
 16:37
16:37
114trading
8 months agoThe Ultimate Forex Course FREE - Lesson 3: Five Fundamental Truths about the Market
17 -
 1:33
1:33
Unleash your inner trader with Team NakedTrader!
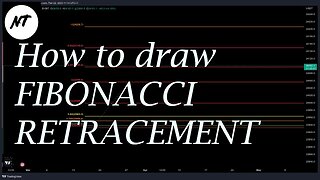
1 year ago $0.01 earnedHow to draw FIBONACCI RETRACEMENT in TradingView? - NakedTrader-serie TradingView #04
25 -
 8:14
8:14
Scholar Trading
1 year agoStay ahead of the market: Forex chart review and predictions February 11