Ever Wonder Why California Is A Mess? Part II
Ever Wonder Why California Is A Mess? Part II
An influx of illegal immigrants, along w/ a Progressive ideology has doomed California. If the U.S. doesn’t switch gears, I think the entire nation will be like California. An influx of low-skilled labor isn’t going to increase our labor force participation rate.
Progressives are having hissy fits over merit-based immigration (which is actually a good Donald Trump idea) because it’s harder to bribe successful folks w/ welfare benefits. What are they going to do? Tell them that if they’re successful we’ll take more of your money to finance an extravagant welfare state?
Broken link? Find it archived https://archive.ph/ https://archive.org/
The background material
https://nces.ed.gov/pubs2016/2016014.pdf
https://nces.ed.gov/pubs2017/2017094.pdf
https://nces.ed.gov/pubs2018/2018070.pdf
https://nces.ed.gov/pubs2015/2015011.pdf
https://nces.ed.gov/pubs2016/2016006.pdf
https://nces.ed.gov/pubsearch/getpubcats.asp?sid=091#061
https://www.cnsnews.com/news/article/terence-p-jeffrey/least-educated-state-california-no-1-percentage-residents-25-and [NOTE: see NCES Table 219.50 in conjunction w/ this]
https://www.census.gov/quickfacts/fact/table/nj,co,fl,US/PST045218 (Race and Hispanic Origin)
https://www.census.gov/quickfacts/fact/table/az,nv,tx,nm,ca,US/PST045218 (Race and Hispanic Origin)
For data on out-of-wedlock births & other source data, see one of my previous videos on California. https://www.youtube.com/watch?v=sVBxOUm54Qg
Table 401.60. U.S. Department of Education appropriations for major programs, by state or jurisdiction: Fiscal years 2012-2016 (language assistance or English language acquisition)
From FY2012-16, California received $759 million for language assistance or English language acquisition classes from federal taxpayers.
Table 107. Percent of high school dropouts (status dropouts) among persons 16 to 24 years old, by sex and race/ethnicity [NOTE: For years 1998-2001]
1998 US avg all races 11.8
1999 US avg all races 11.2
2000 US avg all races 10.9
2001 US avg all races 10.7
1998-2001 Cumulative avg 11.2
1998 Hispanic origin 29.5
1999 Hispanic origin 28.6
2000 Hispanic origin 27.8
2001 Hispanic origin 27
1998-2001 Cumulative avg 28.2
Table 219.80. Percentage of high school dropouts among persons 16 through 24 years old (status dropout rate) and number of status dropouts, by noninstitutionalized or institutionalized status,
birth in or outside of the United States, and selected characteristics. [NOTE: For years 2010-16]
You are far, far more likely to not be in the labor force if you dropped out of high school [e.g. table 504.20].
2010 US avg all races 8.3
2011 US avg all races 7.7
2012 US avg all races 7.0
2013 US avg all races 6.8
2014 US avg all races 6.3
2015 US avg all races 6.0
2016 US avg all races 5.8
2010-16 cumulative avg 6.8
2010 Hispanic 16.7
2011 Hispanic 14.5
2012 Hispanic 12.8
2013 Hispanic 11.8
2014 Hispanic 10.7
2015 Hispanic 9.9
2016 Hispanic 9.1
2010-16 cumulative avg 12.2
2011 “For those born outside of the United States”, “Hispanic” 27.9
2012 “For those born outside of the United States”, “Hispanic” 24.2
2014 “For those born outside of the United States”, “Hispanic” 20.8
2015 “For those born outside of the United States”, “Hispanic” 18.7
2016 “For those born outside of the United States”, “Hispanic” 16.1
Cumulative avg for selected years (not all were available) = 21.5
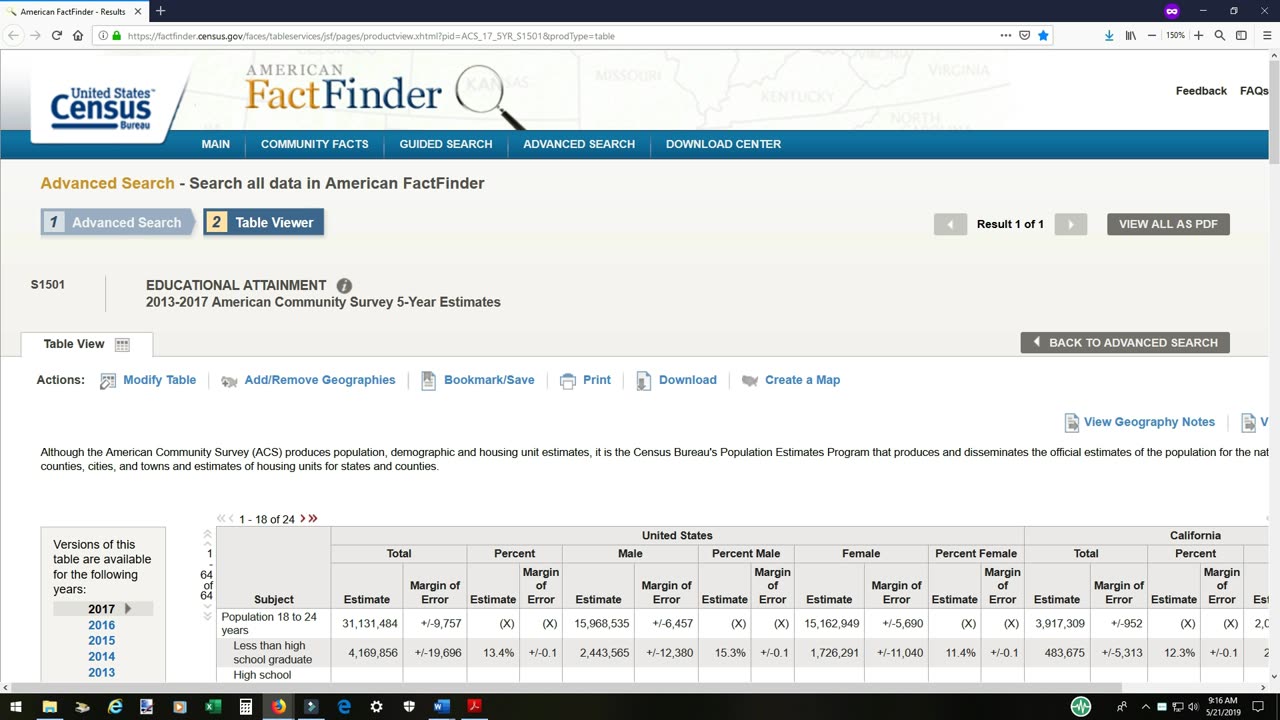
California ranks No. 1 among the 50 states for the percentage of its residents 25 and older who have never completed ninth grade and 50th for the percentage who have graduated from high school, according to new data from the Census Bureau… 9.7 percent of California residents 25 and older, the Census Bureau says, never completed ninth grade. Only 82.5 percent graduated from high school… California and Texas—while having the highest percentages of residents 25 and older who never finished ninth grade and the lowest percentages who graduated from high school—are the nation’s two most populous states.
In fact, the 2,510,370 California residents 25 and older who, according to the Census Bureau, never finished ninth grade outnumber the entire populations of 15 other states. In California, children are required to attend school from six years of age until they are 18… The Census Bureau’s American Community Survey queries a random sample of more than 3.5 million U.S. households each year and publishes a one-year estimate for each year. The five-year estimate, the bureau says, “is a weighted average of the five one-year estimates.” The newly released five-year estimates are for the period from 2013 through 2017.
Nationwide, 5.4 percent of residents 25 and older have never finished ninth grade, according to the latest five-year estimates.
Turning to Table 104.70: Number and percentage distribution of 6- to 18-year-olds, by parent’s highest level of educational attainment, household type, and child’s race/ethnicity & in the *older literature* it is Table 12: Percentage distribution of 6- to 18-year-olds, by parent’s highest level of educational attainment, household type, and child’s race/ethnicity.
2006, Both household types, (single-parent & two-parent household) all ethnic groups (White, Black, Hispanic, Asian, etc.) “Less than high school completion” = 11.2%
2006, Two-parent household, all ethnic groups (White, Black, Hispanic, Asian, etc.) “Less than high school completion” = 7.4%
2006, Single-parent household, all ethnic groups (White, Black, Hispanic, Asian, etc.) “Less than high school completion” = 19.2%
2006, Two-parent household, Hispanic, “Less than high school completion” = 29.5%
2006, Single-parent household, Hispanic, “Less than high school completion” = 39.1%
------------------------------------------
2008, Both household types, (single-parent & two-parent household) all ethnic groups (White, Black, Hispanic, Asian, etc.) “Less than high school completion” = 10.9%
2008, Two-parent household, all ethnic groups (White, Black, Hispanic, Asian, etc.) “Less than high school completion” = 7.4%
2008, Single-parent household, all ethnic groups (White, Black, Hispanic, Asian, etc.) “Less than high school completion” = 18.3%
2008, Two-parent household, Hispanic, “Less than high school completion” = 28.7%
2008, Single-parent household, Hispanic, “Less than high school completion” = 38%
--------------------------------------------------------------------
2010, Both household types, (single-parent & two-parent household) all ethnic groups (White, Black, Hispanic, Asian, etc.) “Less than high school completion” = 11.6%
2010, Two-parent household, all ethnic groups, (White, Black, Hispanic, Asian, etc.) “Less than high school completion” = 7.1%
2010, Single-parent household, all ethnic groups, (White, Black, Hispanic, Asian, etc.) “Less than high school completion” = 20.3%
2010, Two-parent household, Hispanic, “Less than high school completion” = 25%
2010, Single-parent household, Hispanic, “Less than high school completion” = 37.4%
---------------------------------------------------
2011, Both household types, (single-parent & two-parent household) all ethnic groups, (White, Black, Hispanic, Asian, etc.) “Less than high school completion” = 11.2%
2011, Two-parent household, all ethnic groups (White, Black, Hispanic, Asian, etc.) “Less than high school completion” = 7.5%
2011, Single-parent, all ethnic groups (White, Black, Hispanic, Asian, etc.) “Less than high school completion” = 18.3%
2011, Two-parent household, Hispanic, “Less than high school completion” = 26.8%
2011, Single-parent household, Hispanic, “Less than high school completion” = 36.9%
---------------------------------------------------------------
2013, Both household types, (single-parent & two-parent household) all ethnic groups, (White, Black, Hispanic, Asian, etc.) “Less than high school completion” = 10.8%
2013, Two-parent household, all ethnic groups (White, Black, Hispanic, Asian, etc.) “Less than high school completion” = 7.2%
2013, Single-parent, all ethnic groups (White, Black, Hispanic, Asian, etc.) “Less than high school completion” = 17.6%
2013, Two-parent household, Hispanic, “Less than high school completion” = 24.9%
2013, Single-parent household, Hispanic, “Less than high school completion” = 35.2%
---------------------------------------------
2016, Both household types, (single-parent & two-parent household) all ethnic groups, (White, Black, Hispanic, Asian, etc.) “Less than high school completion” = 10.4%
2016, Two-parent household, all ethnic groups (White, Black, Hispanic, Asian, etc.) “Less than high school completion” = 6.4%
2016, Single-parent, all ethnic groups (White, Black, Hispanic, Asian, etc.) “Less than high school completion” = 17.8%
2016, Two-parent household, Hispanic, “Less than high school completion” = 20.8%
2016, Single-parent household, Hispanic, “Less than high school completion” = 32.3%
-------------------------------------------
Both household types, all ethnicities cumulative avg. (2006, 2008, 2010-11, 2013, 2016) = 11%
Two-parent households, all ethnicities cumulative avg. (2006, 2008, 2010-11, 2013, 2016) = 7.2%
Single-parent households, all ethnicities cumulative avg. (2006, 2008, 2010-11, 2013, 2016) = 18.6%
Two-parent household Hispanic cumulative avg. (2006, 2008, 2010-11, 2013, 2016) = 26%
Single-parent household Hispanic cumulative avg. (2006, 2008, 2010-11, 2013, 2016) = 36.5%
------------------------------------------------
More uncomfortable data, out-of-wedlock birth rates in states w/ higher-than-average “Hispanic” populations. I covered this previously for California & New Mexico, it’s worth revisiting.
Births to unmarried women, by race and Hispanic origin of mother: United States, each state and territory
California average, all races 2010-17 = 39.25%
California Hispanic 2010-17 = 52.8%
California Black 2010-17 = 66.85%
California White 2010-17 = 23.58%
New Mexico average, all races 2010-17 = 51.73%
New Mexico Hispanic 2010-17 = 57.95%
New Mexico Black 2010-17 = 55.41%
New Mexico White 2010-17 = 30.56%
Texas average, all races 2010-17 = 41.8%
Texas Hispanic 2010-17 = 50.6%
Texas Black 2010-17 = 63.6%
Texas White 2010-17 = 26.8%
Arizona average, all races 2010-17 = 45.1%
Arizona Hispanic 2010-17 = 56.6%
Arizona White 2010-17 = 30.5%
Arizona Black 2010-17 = 62.4%
Nevada average, all races 2010-17 = 46%
Nevada Hispanic 2010-17 = 54.2%
Nevada White 2010-17 = 34%
Nevada Black 2010-17 = 72.8%
Florida average, all races 2010-17 = 47.6%
Florida Hispanic 2010-17 = 50.9%
Florida White 2010-17 = 36.9%
Florida Black 2010-17 = 69.2%
Colorado average, all races 2010-17 = 23%
Colorado Hispanic 2010-17 = 34%
Colorado Black = 40.4%
Colorado White = 17.1%
New Jersey, all races 2010-17 = 35.3%
New Jersey Hispanic 2010-17 = 59.2%
New Jersey Black 2010-17 = 67.7%
New Jersey White 2010-17 = 18.5%
Dishonorable Mention: District of Columbia, all races 2010-17 = 50.8%
District of Columbia Hispanic 2010-17 = 61.2%
District of Columbia Black 2010-17 = 78.1%
District of Columbia White 2010-17 = 5.7%
Dishonorable Mention II: Mississippi average, all races 2010-17 = 54.07%
Mississippi Hispanic 2010-17 = 54.52%
Mississippi Black 2010-17 = 80.6%
Mississippi White 2010-17 = 32.35%
USA average all races 2010-17 = 40.36%
USA average Hispanic 2010-17 = 53%
USA average White 2010-17 = 29%
USA average Black 2010-17 = 71.1%
In the states that I covered that have a much larger than average “Hispanic” population [NOTE: Make sure you take a gander at all the Census “race/ethnicity” designations] – California, New Mexico, Texas, Arizona, Nevada, Florida, Colorado & New Jersey – the Hispanic out-of-wedlock birth rate was 52%. The only state that was any sort of outlier was Colorado.
The overall average for all races in those states was 41.2%.
Sans Colorado the average was 54.6% for “Hispanic.” For all races in those states sans Colorado it was 43.8%. America has a problem—we have a lot of unskilled (or at least very irresponsible) immigrants failing to finish high school, dropping out of the labor force & having children who don’t finish high school, drop out of the labor force & Bernie Sanders is there w/ your wallet to save the day.
A merit-based immigration system is something I’ve been in favor of for a long time. Jobs are merit-based, always have been. A meritocracy in the workplace dictates that the best employees get “better” schedules, better pay & promotions.
If you can’t run the forklift, if you can’t drive the truck, if you can’t get enough units/hour then guess what? They will find something else for you to do or let you go. If you can’t manage the production floor effectively & it’s organized chaos, someone else will do it for you.
Immigration should be no different, there’s nothing wrong w/ a meritocracy because the business of America is business, not global or domestic handouts.
I’ve said it many times before, I will say it again—America’s people were voting for crazy people (like FDR & Truman) back in the 1940s & 1950s, w/ one important caveat—those people themselves weren’t crazy & they practiced that lost craft called “personal responsibility.”
Many of those folks were those who emigrated to these United States from Europe in the 1910s & 1920s. Those folks didn’t have a welfare state to take advantage of, even if they were privy to doing so. They learned English, they integrated, they built families & most important—the family unit was largely intact.
Many of those folks were part of “The Greatest Generation” that helped us win World War II & turned America into an economic powerhouse (these folks also unfortunately voted in pols like FDR, Truman & LBJ—socialists who started this grand welfare state).
That ALL started to change in the 1960s & here we are seeing the nuclear family crumbling & a lot of emasculated soyboys like Bernie Sanders, Stan Seder, Bill Maher, Bruce Jenner & Beta-male O’ Rourke.
I blame “We The People” as much as I blame the cockroaches in Washington, there are a lot of folks in this country that need some tough love, some personal responsibility & probably a lifetime supply of condoms & IUDs.
If you’re in a single-parent household you are not doomed, nobody is saying that. However, those in single-parent households are more likely to have an absentee father or mother (as opposed to regular visits or shared living arrangements) & those in single-parent households (especially those who were NOT born here) are more likely to be drop out of high school, far more likely to live w/ a parent who has no education & far, far more likely to NOT be in the labor force.
This is a huge problem. It’s also become an expensive problem as taxpayers are held hostage by those who seek to buy Peter’s vote w/ Paul’s money.
Ergo, we do need to shift from a family & refugee immigration program to an economic & merit-based immigration system. Nancy Pelosi says, “nobody is without merit.” Uh, no. Folks who have HIV/AIDS, tuberculosis, STDs, gang-affiliations, lack of a family structure—have no business being here.
If we didn’t have an extravagant welfare state/cradle-to-grave entitlement structure this would be less of a problem. But we do have those obstacles to deal with & bringing in more unskilled labor that isn’t participating in the labor force isn’t going so solve our oncoming economic problems—it will exacerbate them.
It’s not racist to point out that California has a lot of unskilled Hispanics in single-parent households that aren’t participating in the labor force (merit-based immigration would solve much of that). It’s not racist to point out many of them are on welfare. It’s not racist to point out that California’s public education system is failing all ethnic groups there, especially Hispanics & Blacks.
Just as it’s not racist to point out that Mississippi has a lot of white trash that have kids out of wedlock, no family structure, dropping out of high school, high-illiteracy rates & lots of STDs.
Just as it’s not racist to point out that Mississippi’s black residents are usually poor because daddy isn’t around. It’s not racist to point out the truth, but some in this age of massive political correctness want to make it that way & shout-down anyone who dares oppose them.
I guess if “white privilege” (and maybe “Asian privilege” too) means I had two parents that were always around, always worked, always gave me more love than I deserved & always provided for me—then I am guilty as charged.
Bill Maher is right about one thing (although I disagree to how he arrives at this conclusion & I will amend his quote slightly), many Americans (including Bill Maher) are ignorant & very irresponsible.
It’s not my fault whites in Mississippi are failing & it’s certainly not my fault that California bringing-in droves of unskilled Hispanics is failing. Our current immigration system is failing Asian & Hispanic immigrants who are educated, who do have two-parent households, who are practicing that lost art called “personal responsibility.”
As far as most Progressives go who disagree with me, void of facts—it’s easy to conspicuously compassionate when you do not pay the cost. Have a nice day & you have been warned!
This video originally uploaded on YouTube back in 2019
-
 2:32:03
BlackDiamondGunsandGear
14 hours agoAFTER HOURS ARMORY w/ DLD & John from GOA & FLR
29.7K3 -
 1:05:28
Man in America
15 hours agoTREASON? Obama, Hillary, and Soros in the New World Order Agenda EXPOSED w/ Mel K
92.3K82 -
 2:22:46
The Connect: With Johnny Mitchell
15 hours ago $7.03 earnedOne Man's Mission To Stop Human Trafficking: How A Billionaire Mercenary Saved Hundreds Of Children
27.1K18 -
 2:35:13
Tundra Tactical
11 hours ago $14.16 earned🔫 California Ammo Win, Sig Sauer P320 Controversy, Meme Review & Would You Rather! 🎉🔥
42.6K6 -
 16:24
16:24
Forrest Galante
8 hours ago6 Deadliest Man Eaters to Ever Exist
29.8K9 -
 10:14
10:14
MattMorseTV
13 hours ago $16.21 earnedThe EU is in HOT WATER.
97.7K60 -
 6:51:32
The Rabble Wrangler
1 day agoPUBG with The Best in the West!
26.3K -
 3:57:19
EvilT4000
11 hours ago $9.50 earnedSaturday.....🟢For energy and focus click my Dubby link!
37.1K3 -
 3:02:55
SlingerGames
8 hours agoSpartan Night - Halo and More | Creator for @SELFMADEGGS
24.1K -
 3:57:49
Mally_Mouse
13 hours agoSpicy Saturday!! - 10k CELEBRATION! - Let's Play: Labyrinthine
37K1