Premium Only Content

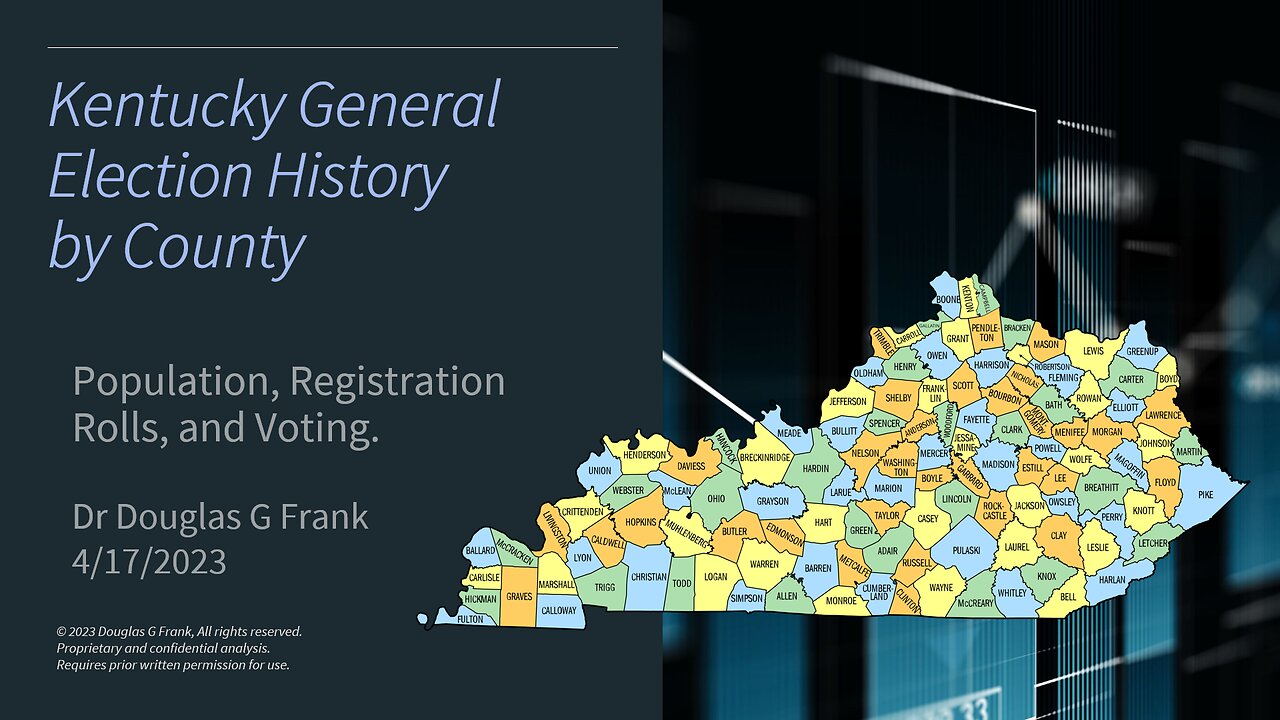
Kentucky Election History Summary Slides
Graphs of the election history for each KY county are provided. Data are from the Secretary of State and the US Census. A summary of the entire state is included at the end.
Each graph shows the population trend for voting age residents, the number of registrants for each federal election, the recent monthly numbers of registrants, and the number of votes tallied in each federal election.
More than forty counties have more "active voters" in the rolls than they have voting age residents. After removal of felons, over eighty counties have more "active voters" than available population.
The KY Secretary of State claims that he is cleaning the voter rolls. His recent meager attempt can be seen in the graphs. Not a very good record after 3+ years in office.
Even after the SoS "clean up," Kentucky still has some of the dirtiest voter rolls in the entire country.
-
 LIVE
LIVE
We Like Shooting
1 day agoDouble Tap 401 (Gun Podcast)
144 watching -
 1:16:11
Donald Trump Jr.
4 hours agoMy Father Puts Maduro’s Gangs on Notice — and Sends Them Packing,
84.2K118 -
 51:01
51:01
BonginoReport
4 hours agoTrump Banishes Violent Gangs, Dunks on them with Hilarious Videos (Ep. 06) - 03/17/2025
74K108 -
 1:13:08
Kim Iversen
5 hours agoWar With Iran: Trump Marches To Israel's Drumbeat | Dictator-In-Chief? Is Trump Going Too Far?
61.5K161 -
 36:54
36:54
Kimberly Guilfoyle
3 hours agoBREAKING NEWS on Deportations, Live with Mike Davis and Nicole Kiprilov | Ep205
43.6K19 -

2 MIKES LIVE
7 hours ago2 MIKES LIVE #193 with Dr. Simone Gold!
19K2 -
 54:34
54:34
LFA TV
1 day agoRogue Judges Are the Real Constitutional Crisis | TRUMPET DAILY 3.17.25 7PM
16.7K2 -
 52:30
52:30
Candace Show Podcast
5 hours agoStraight Husbands vs Ryan Reynolds | Tucker Carlson vs Brigitte Macron | Candace Ep 161
108K75 -
 1:19:24
vivafrei
8 hours agoBongino's Day 1 in the FBI! Swatting Frenzy? Carney & Macron Sitting in a Globalist Tree! & MORE!
144K152 -
 1:06:08
The Amber May Show
10 hours ago $1.15 earnedHow Media Shapes Narratives: Understanding Propaganda and Character Assassination
22.3K1