The Scariest Graph in History: A Wake-Up Call for Climate Action
2 years ago
6
In this video, we'll take a closer look at a graph that some experts are calling the scariest graph ever created. This graph shows a dramatic increase in global temperatures over the past century, and it paints a bleak picture of the future if we don't take action to address climate change. We'll examine the data behind the graph and explore the potential consequences of a world that continues to warm at such a rapid pace. From rising sea levels to devastating weather patterns, this graph illustrates the urgency of the climate crisis and the need for immediate action. Join us as we dive into what could be the scariest graph in history.
Loading 1 comment...
-
 DVR
DVR
Mark Kaye
2 hours ago🔴 TRUMP Furious Over Bad Bunny Super Bowl Halftime Show
4.12K1 -
 46:58
46:58
MattMorseTV
3 hours ago $6.20 earned🔴COURT DATE for Kirk's ASSASSIN.🔴
26.6K26 -
 DVR
DVR
Nerdrotic
3 hours ago $2.02 earnedOne Woke After Another | JK Rowling NUKES Emma Watson - Nerdrotic Nooner 520
27.4K4 -
 2:06:35
Steven Crowder
5 hours agoTrump Hammers Portland: ANTIFA is a Terrorist Organization that Must be Crushed
372K254 -
 2:03:56
Side Scrollers Podcast
3 hours agoSmash Pro DEMANDS “Woke Echo Chamber” + EA SOLD To Saudis + More | Side Scrollers
10.7K -
 LIVE
LIVE
Viss
3 hours ago🔴LIVE - How To Win in PUBG - PUBG 101 with Viss
82 watching -
 1:46:56
The Mel K Show
2 hours agoMORNINGS WITH MEL K - The Bow Has Broken: Justice is Coming 9-29-25
24.4K8 -
 1:01:09
The Rubin Report
3 hours agoCNN Liberals Go Silent as Guest Points Out Fact After Fact on Left Wing Violence
42.2K62 -
 2:04:17
Benny Johnson
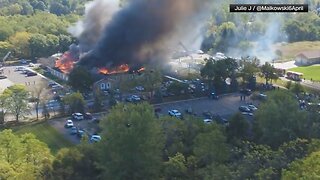
4 hours agoChristianity Under Attack: Trump Declares 'Epidemic of Violence' on Christians As Church Shot,Burned
110K103 -
 1:23:24
Nikko Ortiz
4 hours agoChurch Shooting And Arson Attack In Michigan - Rumble LIVE
37.9K5