Gbpaud live signal how to read Live Currency Heat Map With Volume Spread Analysis
Your Queries:-
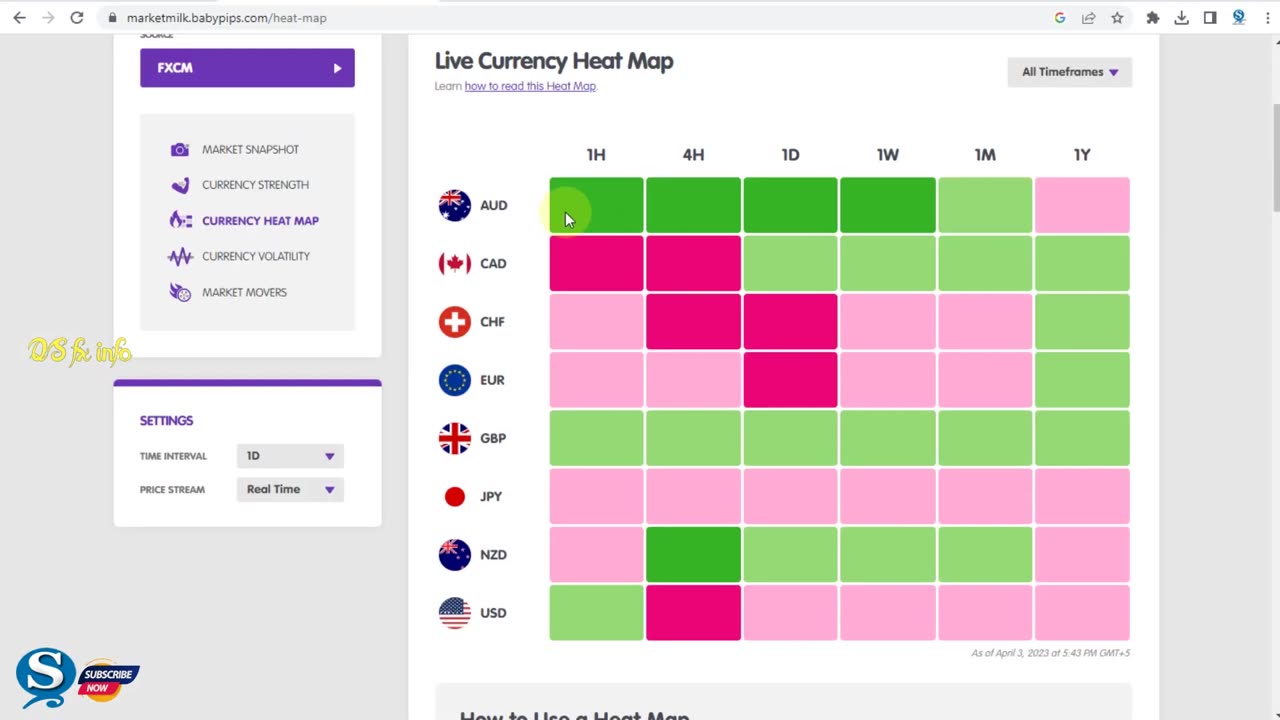
A live currency heat map with volume spread analysis is a tool used to visualize the performance of different currency pairs in the forex market. Here's a step-by-step guide on how to read it:
Identify the currency pairs: The heat map will display different currency pairs in rows and columns. The first step is to identify the currency pairs that you're interested in analyzing.
Look for color-coded indicators: Each currency pair will have a cell with a color-coded indicator. The color coding is usually based on the performance of the currency pair relative to its peers. For example, if the currency pair is performing well, the cell will be green, while if it's performing poorly, the cell will be red. The intensity of the color will also reflect the strength of the performance.
Check the volume: The volume spread analysis component of the heat map will display the trading volume of each currency pair. This can be useful in identifying market sentiment and confirming price movements. The higher the volume, the more significant the price movement is likely to be.
Look for patterns: By analyzing the color-coded indicators and volume data, you may be able to identify patterns in the performance of the currency pairs. For example, you may notice that certain currency pairs tend to perform well during specific trading sessions or that certain pairs tend to move in sync with each other.
Compare with other tools: It's important to remember that a currency heat map is just one tool in your forex analysis toolbox. It's always a good idea to compare the information you get from a heat map with other tools like technical indicators, fundamental analysis, and news events.
Overall, reading a live currency heat map with volume spread analysis requires a basic understanding of forex trading and market analysis. With practice, you can use this tool to gain insights into the forex market and make more informed trading decisions.
how to read Live Currency Heat Map With Volume Spread Analysis
#QSForex
Rules
1.⚠️Follow Money management & Risk management.
2.⚠️Never trade without confirmation.
3.⚠️Never rely on signals, do your own analysis and research too.
4.⚠️Read the disclaimer and be 100% responsible for your own actions.
⚠️Warning! I am not a financial expert, all sharing is for entertainment and learning purposes only. Everyone is responsible for their own decisions.
Please Subscribe My Youtube Channel For More Videos Thanks.
website link below 👇👇👇
http://bit.ly/42HBacK
Free fx signal Telegarm link below
Pips sinper free join 👇👇👇
https://t.me/Pipssinperfree
follow me on twitter link below
https://bit.ly/3nx1KFt
follow me on facebook page link below
https://bit.ly/40rGVtt
follow me on instagram link below
https://bit.ly/40OVwzf
****************************************************
Our Recommended Brokers Are👇👇👇
ICMarkets : - http://bit.ly/3ziVK5G
==Subscribe my youtube channel==
========================================
[online At home Forex trading Business Sekhaen
++++++++++++++++++++++++++++++++++++++++
How to Install VSA TradeGuider Software In MT4 VSA analysis Wyckoff Method
https://youtu.be/qVd_Ei6mkZ4
Best Online Forex trading Paid Course and Classes
https://youtu.be/Xf_TIGtJTI4
---------------------------------------------------------------------------------------------
All indicators or templates telegram channel men hay
👉 Telegram Group: https://t.me/Qsforexinfo
-
 LIVE
LIVE
Russell Brand
1 hour agoGavin de Becker | Fear, Freedom & Resisting Control - SF642
2,038 watching -
 10:34
10:34
Clownfish TV
3 hours agoGetting 'Canceled by Trump' is GREAT for Ratings?! | Clownfish TV
6883 -
 14:42
14:42
Professor Gerdes Explains 🇺🇦
2 hours agoThis ONE SENTENCE from Putin Guarantees a Long War
-
 19:05
19:05
Sponsored By Jesus Podcast
2 days agoI Lost the World But Gained My SOUL | Freedom in Christian Suffering
1.14K3 -
 14:47
14:47
Dr. Nick Zyrowski
15 days agoFasting Is THE Cure - NO FOOD FOR 3 DAYS Completely Heals You!
1.35K9 -
 UPCOMING
ROSE UNPLUGGED
32 minutes agoClimate Fatigue: Is the Whole World Feeling It?
-
 2:01:24
The Charlie Kirk Show
2 hours agoBiblical Borders + The Illegal Superintendent + Shutdown Fever | Deace, Homan | 9.30.2025
148K36 -
 LIVE
LIVE
Badlands Media
10 hours agoGeopolitics with Ghost Ep. 42
1,117 watching -
 2:01:33
Right Side Broadcasting Network
3 hours agoLIVE REPLAY: President Trump Makes an Announcement - 9/30/25
86K27 -
 1:56:03
MattMorseTV
3 hours ago $8.19 earned🔴Trump's Oval Office DECLARATION.🔴
43.3K31