Use a Single Query to find the Top or Middle Quartiles of a Data Set
In this video, I demonstrate how to use subqueries in SQL to find and analyze different quartiles of a data set, such as giving bonuses based on performance. The tutorial explains how to create a subquery, calculate average values, and use various SQL techniques to extract and analyze the top, second, third, and bottom quartiles of a company's revenue. By following this guide, you'll learn how to make your subqueries dynamic and adaptable to changing data.
Keywords: subquery, SQL, quartiles, data analysis, revenue, performance, bonuses, dynamic queries, Pharos Technology, top quartile, second quartile, third quartile, bottom quartile, averages, SQL techniques
See my other channels:
Current news on the economy and economic concepts:
https://www.youtube.com/@doctorecon
Current thoughts on leadership topics:
https://www.youtube.com/@pharosleadership
Blockchain and Cryptocurrency News:
https://www.youtube.com/@pharosblockchain
-
 0:42
0:42
Pharos Technology
1 year agoRanking Data Sets by Percentiles in Microsoft Access
1 -
 10:28
10:28
aracelilyn
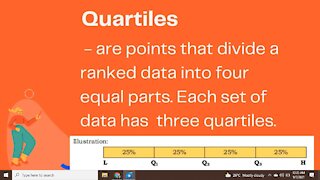
2 years agoQUARTILES OF UNGROUPED DATA
4 -
 5:02
5:02
user329
3 years agoPIVOT FUNCTION
18 -
 18:20
18:20
About Programming Code
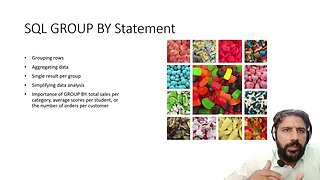
11 months agoSQL GROUP BY Statement: Mastering Data Grouping in SQL
7 -
 7:44
7:44
acrdan
1 year agoMeasures of Position and Relative Standing: Finding Percentiles
-
 2:46
2:46
RahimZulfiqarAli
1 year agoGet Data from Web & Find Top 3 Gainers | Pakistan Stock Exchange| Power Query & Formula in Excel
4 -
 17:05
17:05
itmadesimple
11 months agoMaster SQL Aggregate Functions: Beginner's Guide
14 -
 14:47
14:47
humulica
1 year agoIntroduction to Pivot Tables, Charts, and Dashboards
4 -
 17:45
17:45
acrdan
2 years agoMeasures of Relative Standing: Percentiles and Quartiles
2 -
 5:17
5:17
Excel Plus Studio
1 year agoUSE QUICK ANALYSIS TOOL TO ANALYZE LIKE A CHAMP IN EXCEL
23