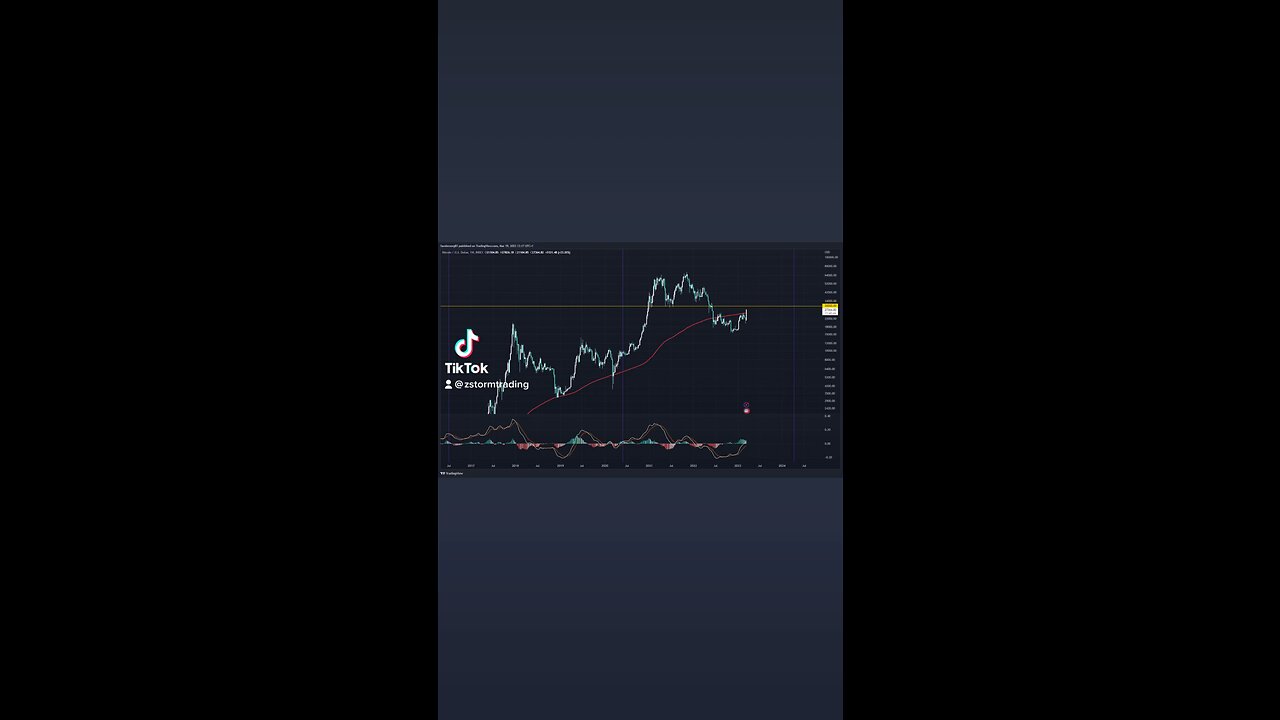
Weekly Chart Bitcoin
Loading comments...
-
 1:00:41
Timcast
2 hours agoTrump MOBILIZING National Guard In NATIONWIDE Crackdown
105K105 -
 LIVE
LIVE
Sean Unpaved
1 hour agoQuarterbacks, Coaches, & Contracts: Sanders' Draft Drama, Meyer vs. Harbaugh, & McLaurin's Big Deal
113 watching -
 2:11:45
Steven Crowder
4 hours agoDonald Trump Vs American Crime: Chicago is Next & Libs Are Freaking Out
250K207 -
 41:08
41:08
Grant Stinchfield
58 minutes agoDemocrats Try to Turn California Into Predator Playground with Proposed "Child Predator Dream Bill"
3.57K2 -
 LIVE
LIVE
Rebel News
1 hour agoCdn troops in Ukraine? Poilievre backs self-defence, Hamas thugs cancel Ottawa Pride | Rebel Roundup
376 watching -
 DVR
DVR
Neil McCoy-Ward
1 hour ago⚠️ OUTRAGE! What They Just Announced For YOUR HOME!!! 🚨
3.82K3 -
 LIVE
LIVE
IrishBreakdown
3 hours agoNotre Dame and Miami Set To Reignite Intense Rivalry
594 watching -
 LIVE
LIVE
The Charlie Kirk Show
1 hour agoChicago Next! + The Blue Slip Problem | Sen. Tuberville, Alex Clark | 8.25.2025
3,036 watching -
 1:20:52
Benny Johnson
3 hours ago🚨Trump LIVE Now: Signs Executive Order ENDING Cashless Bail | Dem Cities PANIC, Which City NEXT?...
58.5K35 -
 1:31:26
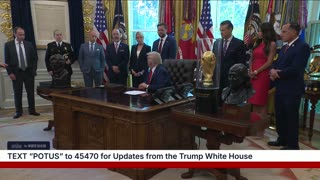
The White House
4 hours agoPresident Trump Signs Executive Orders, Aug. 25, 2025
40.8K19