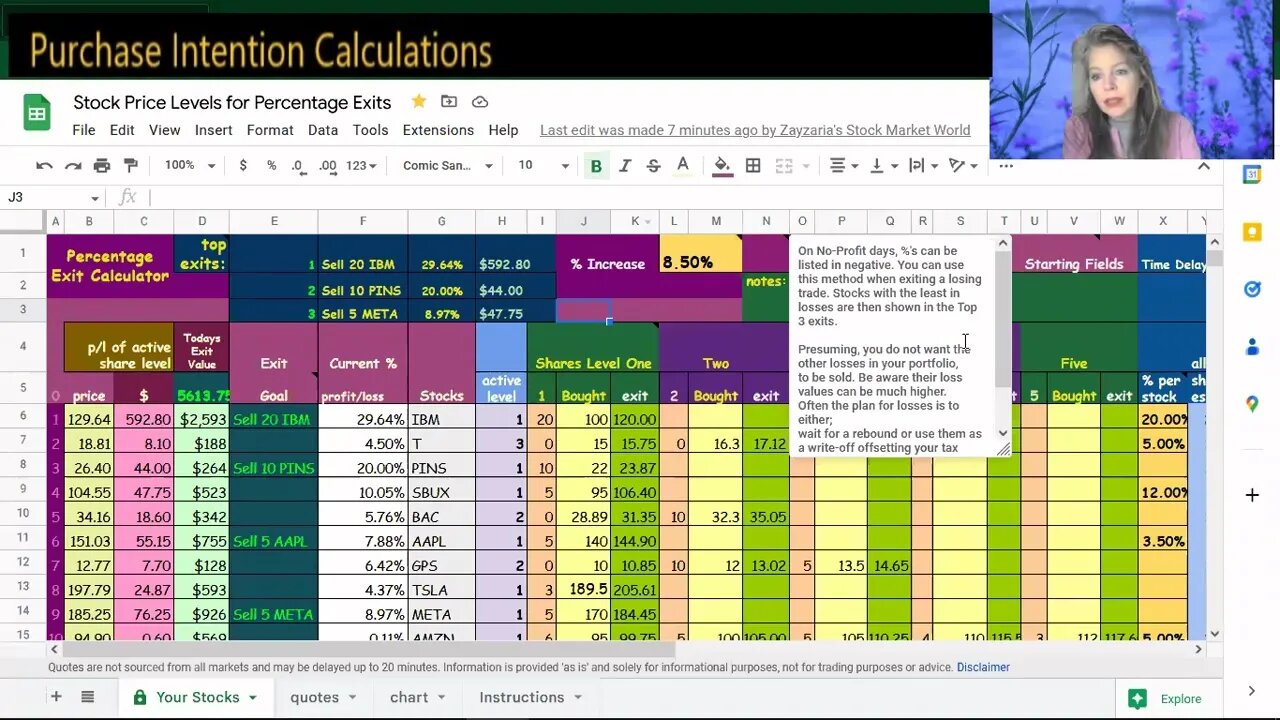
Stock Calculator: Profit-Only & Purchase Intention Calculations
Covering some features of the Calculator, the Chart, How Profit-Only works vs other trading methods, as a safer way to trade for an income.
& The important feature; regarding "Purchase Intentions" per stock:
Which helps calculate each price level & supplies a dedicated number of shares to each price level. Plus the differences when making determinations for Stable stocks vs Riskier stocks.
I will not complicate the sheet further, because the more complicated, people are less apt to:
1) understand it.
2) trade on time, because of time spent reading & updating the google sheet.
Sheet Updating:
There are no manual sheet updates, aside from... "0" shares after a sell,
and after buying shares: adding the #of shares & their $share price.
Changing %'s shouldn't be a time-waster either.
-----------------------------------
To get the Stock Calculator: it's an Etsy Pdf Download, & a link to your private Google sheet:
-----------------------------------
The Trading with Percentages Google Finance Sheet:
$8.98 promo price for the first 50-100 downloads, then expect the price to double.
Quickest Tutorial:
The Google Sheet setup is on the fast intro video of Etsy (link above): pause it per page.
After adding your stocks, #of shares and prices paid,
it will be ready to trade with, alter the % increase to your liking.
-------------------------------------------------
About The Sheet: if you didn't know, includes: pages: Your Stocks, Quotes*, Chart, Instructions
Top 3 Sells & daily sell totals for the active level. *add up to 500 symbols., trade up to 46 at a time.
More info on making an income with your stocks
% Trading with Levels: Basic technique using the sheet:
1). This method holds 5 different* price levels per stock (up to 46 stocks)
*many people already have purchased a particular stock at various prices.
2). Price Levels per stock are listed: lowest to highest price paid.
3). You choose either a Basic % or a Specific % per stock.
4). The "Sell" alert occurs on the sheet when the % gain is reached.
5). The Top 3 winners are listed on the top of the sheet. Good for a Cell Phone View.
6). Active trading: the % increase is much higher for your lowest price paid, ready to be sold via your brokerage platform, for a profit.
7). After an Exit, the share value at that active price level is freed-up to start over again or cash out.
8.) To trade again: Wait for a lower purchase price for the same stock, with a good entry,
or buy another stock at its lower purchase price,
& managing the sheet is only: entering the new "bought" price & #of shares.
9) Portfolio Chart page of the active trading levels: to view the %'s a bit differently.
10). Does not cater towards Stop Loss traders, however, negative %'s are listed to view.
From The Quick 15sec.setup Video:
The price level sections include: 2 squash colors & 1 bright green each,
can be cut & pasted within the same row, from level 1-8, without a problem.
The Instruction page: Is a good source for Teachers with Starter students,
who are giving a course on the method.
---------------------------------------
2nd Tutorial Regarding Trade Entries with a % Indicator: https://youtu.be/Q7e-0L_NCJA
-
 8:27
8:27
MattMorseTV
13 hours ago $10.31 earnedIlhan Omar IMPLICATED in $250,000,000 FRAUD RING.
19.4K97 -
 1:50:00
The Michelle Moore Show
20 hours ago'Prayer Points...President Trump's Economy, Parental Warnings on 6-7 Demonic Ritual, Islamist Leader Reveals the Goal of Islam Ideology, and more' Lt. Mark Taylor The Michelle Moore Show (Nov 10, 2025)
28.3K35 -
 LIVE
LIVE
Lofi Girl
3 years agolofi hip hop radio 📚 - beats to relax/study to
188 watching -
 14:12
14:12
BlabberingCollector
1 day agoHBO Show Update, Audible Full Cast Ensemble Updates, Wizarding World Quick Hits!
76.2K5 -
 2:35:48
FreshandFit
16 hours agoShe Watched Our Show, NOW She's Happily Engaged
247K89 -
 1:49:19
Badlands Media
15 hours agoBaseless Conspiracies Ep. 158: Trump’s World Order, Israel’s Secrets & the MAGA Infiltration
90.5K36 -
 2:54:31
TimcastIRL
10 hours agoIllegal Immigrant ARRESTED After Shooting At DHS, War ERUPTS In Chicago
310K162 -
 5:23:34
Drew Hernandez
1 day agoMARK LEVIN CRASHES OUT & TRUMP SEEKS HOUSING CRISIS SOLUTION
33.5K26 -
 6:29:18
SpartakusLIVE
12 hours ago#1 King of Content leaves your Monday UTTERLY MOTIVATED
55.6K1 -
 2:47:40
Barry Cunningham
13 hours agoBREAKING NEWS: WATCH PARTY WITH PRESIDENT TRUMP ON THE LAURA INGRAHAM SHOW (AND MORE NEWS)
169K46