Premium Only Content
This video is only available to Rumble Premium subscribers. Subscribe to
enjoy exclusive content and ad-free viewing.

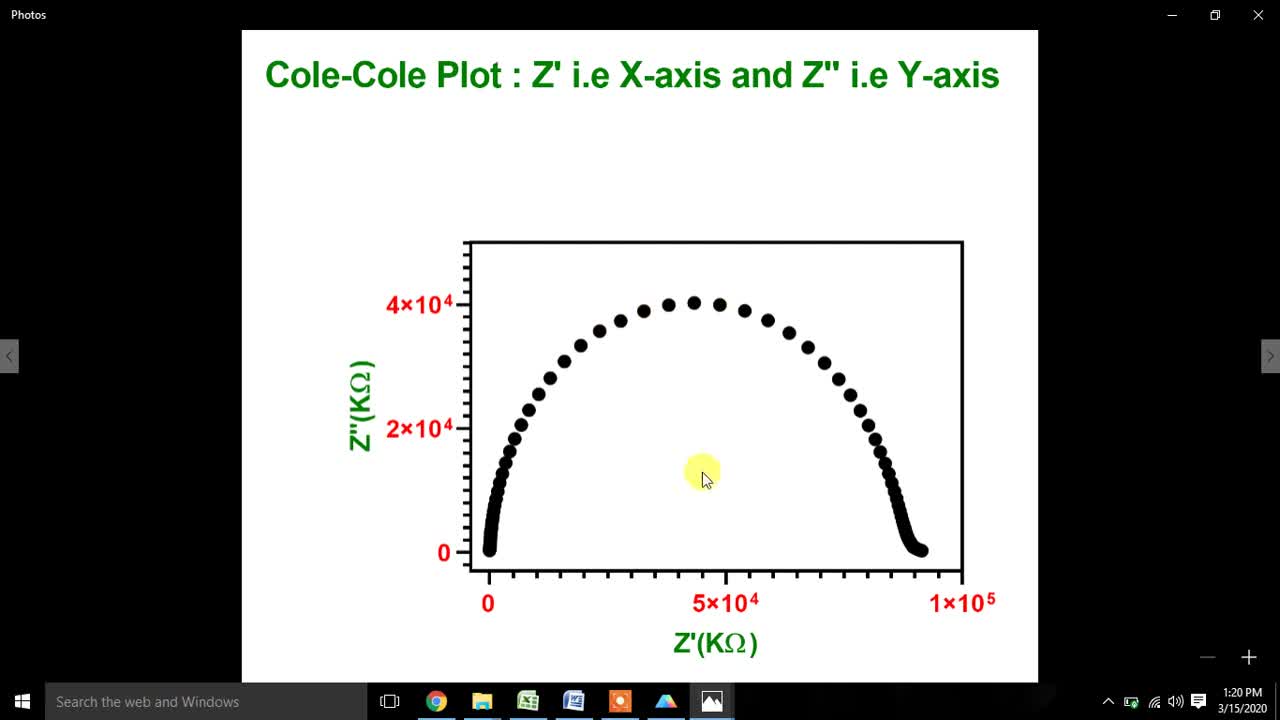
How to plot Cole-Cole or Nyquist Plot from Impedance Spectroscopy data using Prism Software
2 years ago
11
Plot Cole-Cole or Nyquist Plot
Impedance Spectroscopy data
Prism Software
technology technology applications technology background technology benefits nanotechnology nanotechnology definition advantages of nanotechnology introduction to nanotechnology history of nanotechnology nanoscience and nanotechnology nanotechnology applications nanotechnology articles nanotechnology abbreviation nanotechnology and material science nanotechnology applications in medicine application of nanotechnology application of nanotechnology in medicine applications of nanotechnology in daily life articles on nanotechnology nanotechnology books nanotechnology benefits nanotechnology biology nanotechnology benefits in medicine research qualitative research quantitative research value research types of research cancer research research assistant jobs research assistant research and development research analyst research associate research articles research associate salary a research collaboration can be enhanced by research brief research breakthrough scientifics software scientific software scientific software engineer scientific software developer scientific software companies scientific software developer salary scientific software international scientific software solutions scientific software examples scientific software developer jobs scientific software applications scientific analysis software a scientific problem a scientific study a scientific process better scientific software best scientific software scientific software community scientific calculator software scientific calculator software for windows 10 scientific computing software
How to plot Cole-Cole or Nyquist Plot from Impedance Spectroscopy data using Prism Software
Loading comments...
-
 3:21:38
The Charlie Kirk Show
7 hours agoJUDGMENT DAY 2025: The Election Results Stream
186K78 -
 3:51:07
MattMorseTV
8 hours ago $0.77 earned🔴Election Day LIVE COVERAGE.🔴
91.2K47 -
 1:16:51
Flyover Conservatives
1 day agoSHOCKING DATA REVEALS: Young Voters Are Done With the Old GOP - Mark Mitchell, Rasmussen Reports | FOC Show
37.1K16 -
 1:15:28
Sarah Westall
7 hours agoGrooming is Protected and Encouraged by the System – Michelle Peterson and Mike Adamovich
32K10 -
 4:00:13
Akademiks
5 hours agoKendrick tries to Flip the Bots on DRAKE? WHo Beats Jay z in a verzuz. Blueface finally free!
36.5K7 -
 1:38:16
Professor Nez
11 hours ago🚨ELECTION NIGHT 2025 LIVE! Massive Upsets Brewing in New York, New Jersey & Virginia!
31.3K11 -
 4:48:50
Due Dissidence
14 hours agoLIVE: ELECTION RESULTS From NYC, NJ, and VA - Trump Approval CRATERS, Kash's Private Jet CRASH OUT
50.4K22 -
 12:50
12:50
Demons Row
7 hours ago $0.04 earnedBikers of New Jersey 💀🏍️ Pagans, Thunder Guards, and Thug Riders
24.7K6 -
 42:31
42:31
Stephen Gardner
10 hours ago🔥Old Obama Video RESURFACES - His Own Words CONDEMNED Him! Trump Gains MASSIVE Momentum!!
32.2K34 -
 13:09:35
LFA TV
1 day agoLIVE & BREAKING NEWS! | TUESDAY 11/4/25
175K38