Hammer Pattern - Trade - EhsanTrading
What Is a Hammer Candlestick?
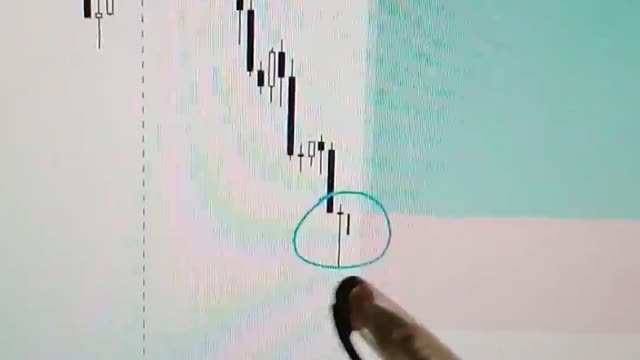
A hammer is a price pattern in candlestick charting that occurs when a security trades significantly lower than its opening, but rallies within the period to close near the opening price. This pattern forms a hammer-shaped candlestick, in which the lower shadow is at least twice the size of the real body. The body of the candlestick represents the difference between the opening and closing prices, while the shadow shows the high and low prices for the period.
Key Takeaways
Hammer candlesticks typically occur after a price decline. They have a small real body and a long lower shadow.
The hammer candlestick occurs when sellers enter the market during a price decline. By the time of market close, buyers absorb selling pressure and push the market price near the opening price.
The close can be above or below the opening price, although the close should be near the open for the real body of the candlestick to remain small.
The lower shadow should be at least two times the height of the real body.
Hammer candlesticks indicate a potential price reversal to the upside. The price must start moving up following the hammer; this is called confirmation.
-
 LIVE
LIVE
The Jimmy Dore Show
2 hours agoTrump TROLLS Newsom Over LA Fires! Zuckerberg & Facebook GIVE UP on Fact Checking!
9,843 watching -
 LIVE
LIVE
Dr Disrespect
9 hours ago🔴LIVE - DR DISRESPECT - DELTA FORCE - ATTACK AND EXTRACT
2,793 watching -
 1:15:19
Dr. Drew
6 hours agoMy Pasadena Home Is Surrounded By CA Wildfires w/ OC Fire Chief Brian Fennessy & LA's John Phillips – Ask Dr. Drew
24.9K9 -
 2:32:12
Melonie Mac
3 hours agoGo Boom Live Ep 33!
10K3 -
 LIVE
LIVE
2 MIKES LIVE
6 hours ago2 MIKES LIVE #164 with Special Guests SARAH WESTALL and ALEC LACE!
320 watching -
 49:16
49:16
Sarah Westall
3 hours agoComparisons: Maui Fire and North Carolina Hurricane – Land & Resource Grabs w/ Michelle Melendez
5.46K10 -
 1:00
1:00
Congresswoman Harriet Hageman
6 hours agoCongresswoman Harriet Hageman Rumble Rollout
19.1K40 -
 3:13:02
Scammer Payback
5 hours agoCalling Scammers Live
34.6K4 -
 13:08
13:08
RealitySurvival
10 hours agoNorth American Union - Why THIS IS A BAD Idea!
15.9K13 -
 DVR
DVR
Redacted News
5 hours agoWEF is in FULL PANIC MODE over Trump, LA wildfires a failure of liberal government | Redacted News
100K184