Double Bottom PATTERN
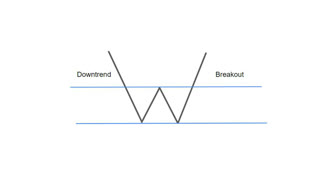
A double bottom pattern is a classic technical analysis charting formation that represents a major change in trend and a momentum reversal from a prior down move in market trading. It describes the drop of a security or index, a rebound, another drop to the same or similar level as the original drop, and finally another rebound (that may become a new uptrend). The double bottom looks like the letter "W." The twice-touched low is now considered a significant support level. While those two lows hold, the upside has new potential.
1
In terms of profit targets, a conservative reading of the pattern suggests the minimum-move price target is equal to the distance of the two lows and the intermediate high. More aggressive targets are double the distance between the two lows and the intermediate high.
-
 0:25
0:25
TradingTrendInfo
10 months agoDouble Bottom Reversal Pattern
15 -
 0:25
0:25
TradingTrendInfo
10 months agoDouble Bottom Reversal Pattern
39 -
 0:51
0:51
The Success Academy
2 years agoHow to Trade Double Tops and Double Bottoms - The Success Academy Article Video
8 -
 1:01
1:01
The Success Academy
2 years agoHow to Trade the Head and Shoulders Pattern
5 -
 3:42
3:42
The Success Academy
1 year agoThe POWERFUL REVERSAL Pattern You DON’T Know - Pipe Tops and Bottoms
20 -
 0:37
0:37
The Success Academy
2 years agoHow to Trade the Bump and Run Reversal Pattern
13 -
 4:54
4:54
FineTimer
1 year agoHow to Make a Double Bottom Pattern on a Shirt
47 -
 1:00
1:00
BeginnerTraderHelper
7 months agoDouble Bottom Pattern Profit Strategy
-
 1:29
1:29
The Success Academy
2 years agoHow to Trade the Diamond Pattern
7 -
 4:02
4:02
The Success Academy
1 year agoPREDICT REVERSALS with ONE Chart Pattern - Horn Tops and Bottoms
68