Double Bottom PATTERN
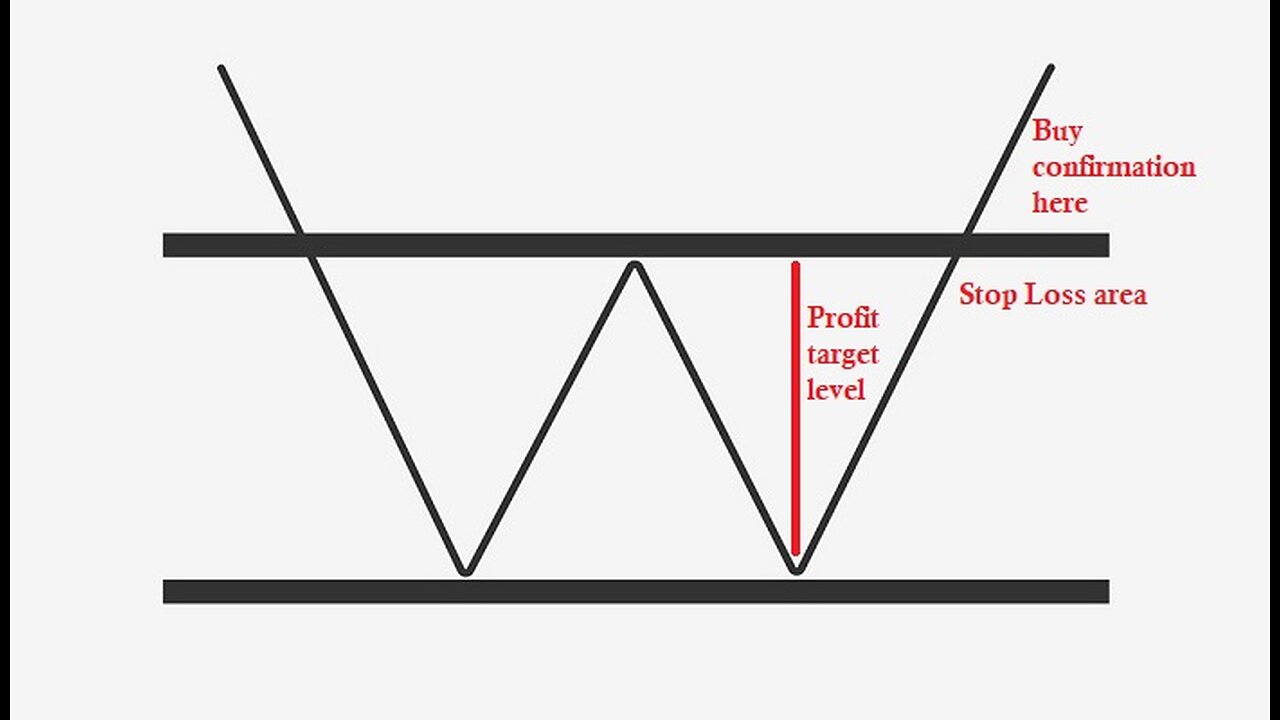
A double bottom pattern is a classic technical analysis charting formation that represents a major change in trend and a momentum reversal from a prior down move in market trading. It describes the drop of a security or index, a rebound, another drop to the same or similar level as the original drop, and finally another rebound (that may become a new uptrend). The double bottom looks like the letter "W." The twice-touched low is now considered a significant support level. While those two lows hold, the upside has new potential.
1
In terms of profit targets, a conservative reading of the pattern suggests the minimum-move price target is equal to the distance of the two lows and the intermediate high. More aggressive targets are double the distance between the two lows and the intermediate high.
-
 LIVE
LIVE
TheCrucible
1 hour agoThe Extravaganza! EP: 38 (9/17/25)
19,161 watching -
 LIVE
LIVE
Kim Iversen
2 hours agoDennis Kucinich Exposes 9/11 Israel's Lies
9,059 watching -
 LIVE
LIVE
Candace Show Podcast
1 hour agoWho Ordered The Hit On Charlie Kirk? | Candace Ep 237
10,778 watching -
 DVR
DVR
Redacted News
2 hours agoThey're LYING about Charlie Kirk's murder and they know it, new details just emerged | Redacted
161K119 -
 LIVE
LIVE
Dr Disrespect
6 hours ago🔴LIVE - DR DISRESPECT - ARENA BREAKOUT: INFINITE - ESCAPE OR LOSE EVERYTHING!
1,203 watching -
 LIVE
LIVE
LFA TV
11 hours agoLFA TV ALL DAY STREAM - WEDNESDAY 9/17/25
1,332 watching -
 38:45
38:45
ArturRehi
5 hours agoZapad 2025 — War Games with No Reserves | Ukraine Update
4.75K3 -
 1:10:31
vivafrei
4 hours agoKash Patel int eh Hot Seat! Kirk Assassin Discord Messages Leaked! Ostrich Farm Under Surveillance?
158K59 -
 1:46:45
The Quartering
4 hours agoCharlie Kirk Revenge! 100s of Woke Teachers Fired, Twitch CEO Called To Testify Over Hasan Pike!
157K38 -
 32:01
32:01
Stephen Gardner
2 hours agoBiden’s FBI PLOT to Silence Charlie Kirk EXPOSED!
27.7K22