THIS Hasn't Been Seen in MORE Than 41 Years!
🟢 TRADE IDEAS & DISCORD: https://www.patreon.com/figuringoutmoney
🟢 BOOKMAP DISCOUNT: https://bit.ly/3F8qdGb
🟢 TRADE STOCKS WITH IBKR: https://bit.ly/3AOcvYo
🟢 Instagram: https://www.instagram.com/figuringoutmoney
🟢 Twitter: https://twitter.com/mikepsilva
______________________________________________________________________________________________
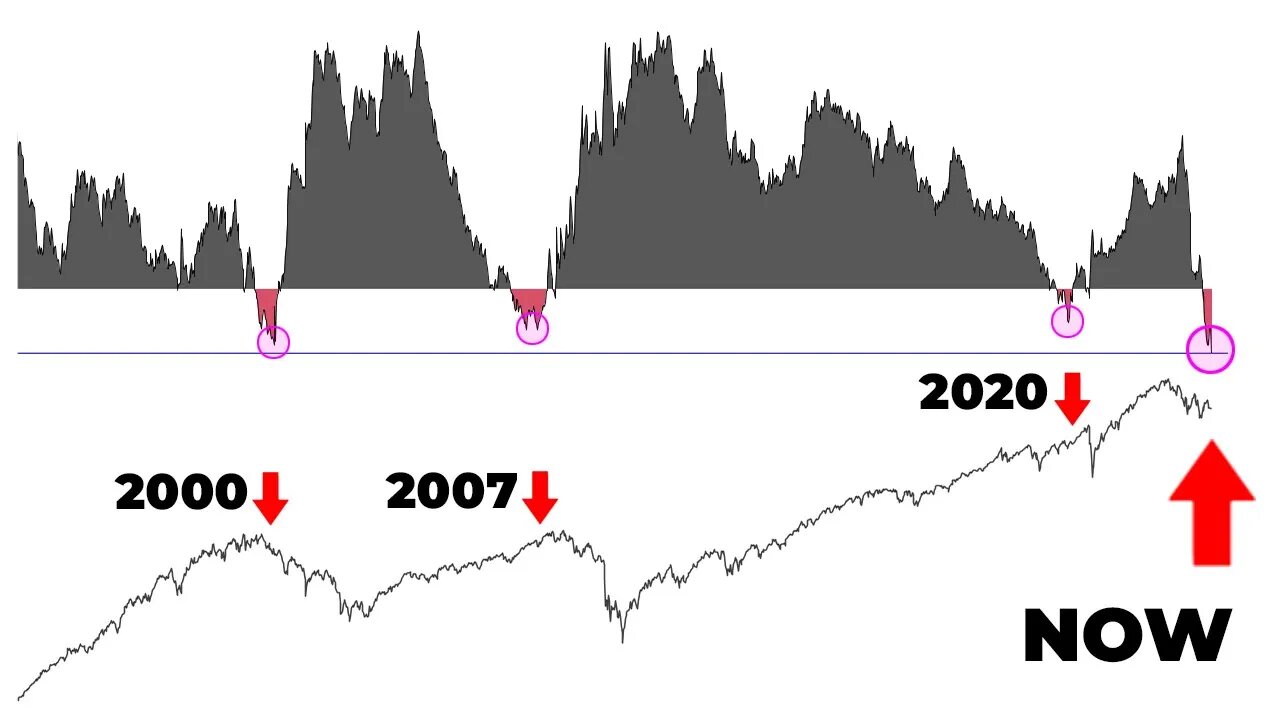
The 10yr - 3mo yield curve is inverted even more in today's trading session . -95 bps. This number has not been seen in more than 41 years and has been one of the top leading indicators of recessions. This is deeper than the 2001 tech bubble bursting, and deeper than the financial crisis. Its going to be interesting to see how this one plays out.
______________________________________________________________________________________________
How To Predict How Far Stocks Can Go (EXPECTED MOVES):
○ https://youtu.be/JT32L89ZpEk
Saylor To Schiff Bitcoin Indicator:
○ https://youtu.be/zuG9Tjnud9k
Show Me The Money Scan:
○ https://youtu.be/dzRjEuUUb5g
Party Starter Scan:
○ https://youtu.be/zzaN91gcJOI
Bouncy Ball Scan:
○ https://youtu.be/7xKOo6vNaq8
Dark Money Scan:
○ https://youtu.be/ZUMuHaSg1ro
Sleepy Monster Scan:
○ https://youtu.be/C9EQkA7uVU8
High Volatility Scan:
○ https://youtu.be/VC327ko8DfE
______________________________________________________________________________________________
DISCLAIMER: I am not a professional investment advisor, nor do I claim to be. All my videos are for entertainment and educational purposes only. This is not trading advice. I am wrong all the time. Everything you watch on my channel is my opinion. Links included in this description might be affiliate links. If you purchase a product or service with the links that I provide I may receive a small commission. There is no additional charge to you! Thank you for supporting my channel :)
-
 20:11
20:11
Figuring Out Money
1 year agoLet's Get Ready To Rumble!
32 -
 LIVE
LIVE
The Quartering
3 hours agoMinnesota Assassin Story GETS WEIRD, WAR With Iran Nearing, Woke Sh**ter At No Kings Day & More
8,940 watching -
 DVR
DVR
Nerdrotic
18 hours ago $1.47 earnedNerdrotic Nooner 495
19.8K3 -
 LIVE
LIVE
Akademiks
5 hours agoDiddy Trial Day 24: Kanye West to Show Back up Today Again? Juror 6. LAST WEEK of Trial! Day 1/30
2,037 watching -
 LIVE
LIVE
Jeff Ahern
1 hour agoMonday Madness with Jeff Ahern
153 watching -
 LIVE
LIVE
blackfox87
3 hours agoMonday Vibez | #DisabledVeteran
224 watching -
 40:02
40:02
MTNTOUGH Podcast w/ Dustin Diefenderfer
5 hours agoTim Sheehy: How His Mental Toughness Took Him From Navy SEAL to Senator | MTNPOD #120
4.16K1 -

Sean Unpaved
3 hours agoRed Sox Roster Reset, Vikings Blueprint, U.S. Open Highlights, & Shohei's Mound Return
24.9K1 -
 1:05:03
Russell Brand
3 hours agoWW3 WARNING! Trump Opens Door To US Involvement + Minnesota assassin ARRESTED - SF597
94.1K64 -
 16:23
16:23
China Uncensored
5 hours agoChina’s EV War: Total Destruction
14.7K1