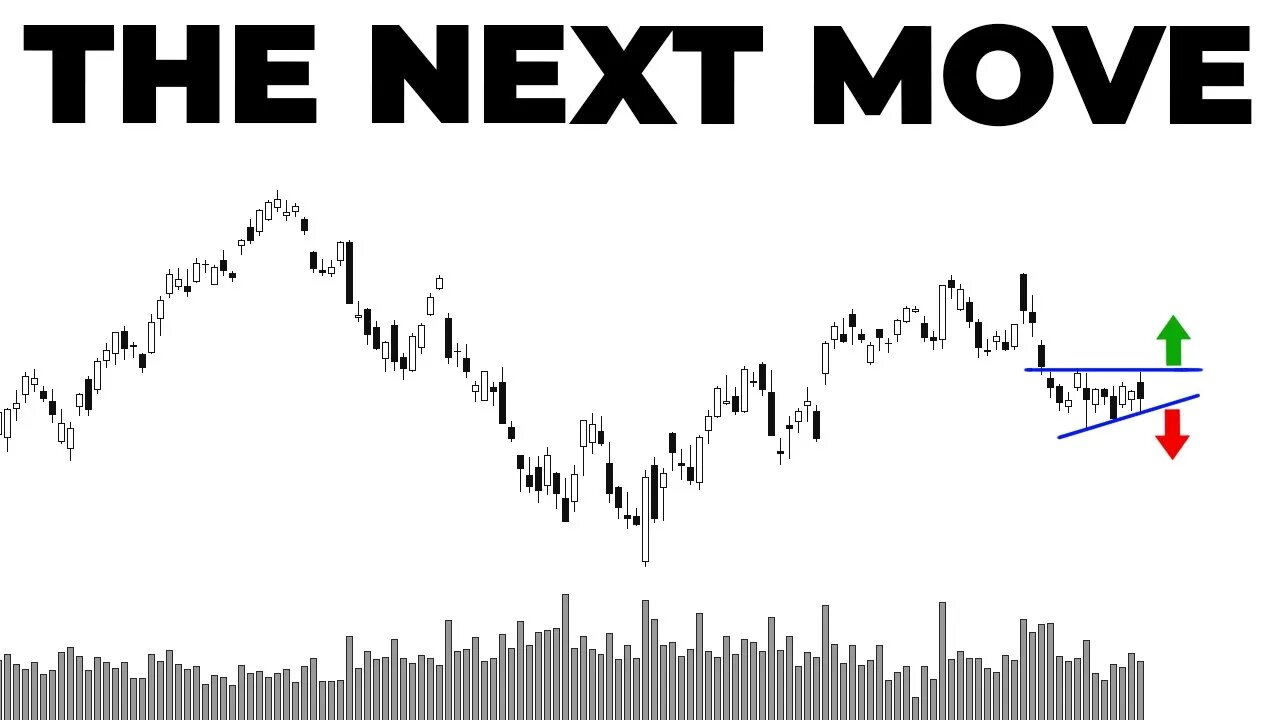
THIS Trading Range Is About To Break!
🟢 TRADE IDEAS & DISCORD: https://www.patreon.com/figuringoutmoney
🟢 BOOKMAP DISCOUNT: https://bit.ly/3F8qdGb
🟢 TRADE STOCKS WITH IBKR: https://bit.ly/3AOcvYo
🟢 Instagram: https://www.instagram.com/figuringoutmoney
🟢 Twitter: https://twitter.com/mikepsilva
______________________________________________________________________________________________
The SP500 trading range is about to break. Today Tesla Stock (TSLA) and Apple Stock (AAPL) got crushed and reached down to their lower weekly Expected Moves. In today's video we map out the technical levels to watch and stock market indicators to be aware of heading into the rest of this week that's filled with macroeconomic data.
______________________________________________________________________________________________
How To Predict How Far Stocks Can Go (EXPECTED MOVES):
○ https://youtu.be/JT32L89ZpEk
Saylor To Schiff Bitcoin Indicator:
○ https://youtu.be/zuG9Tjnud9k
Show Me The Money Scan:
○ https://youtu.be/dzRjEuUUb5g
Party Starter Scan:
○ https://youtu.be/zzaN91gcJOI
Bouncy Ball Scan:
○ https://youtu.be/7xKOo6vNaq8
Dark Money Scan:
○ https://youtu.be/ZUMuHaSg1ro
Sleepy Monster Scan:
○ https://youtu.be/C9EQkA7uVU8
High Volatility Scan:
○ https://youtu.be/VC327ko8DfE
______________________________________________________________________________________________
DISCLAIMER: I am not a professional investment advisor, nor do I claim to be. All my videos are for entertainment and educational purposes only. This is not trading advice. I am wrong all the time. Everything you watch on my channel is my opinion. Links included in this description might be affiliate links. If you purchase a product or service with the links that I provide I may receive a small commission. There is no additional charge to you! Thank you for supporting my channel :)
-
 23:55
23:55
Figuring Out Money
1 year agoWeird Things Are Happening Right Now
60 -
 LIVE
LIVE
Illyes Jr Gaming
11 hours agoCall Of Duty Black Ops 7 LAUNCH DAY!!!!
17 watching -
 LIVE
LIVE
Drew Hernandez
19 hours agoTUCKER CLASHES W/ FBI, TRUMP PUSHES EPSTEIN DISCLOSURE AFTER HOAX CLAIM & IS MEGYN KELLY IN DANGER?
1,226 watching -
 LIVE
LIVE
Phyxicx
1 hour agoRumble Spartans Halo Night! - HMR#20 - 11/14/2025
73 watching -
 LIVE
LIVE
FusedAegisTV
1 day ago*NEW F2P MMORPG, SoulsLike/Action Game // Global LAUNCH - EN Servers 🔴 FUSEDAEGIS
39 watching -

Barry Cunningham
5 hours agoFOOD STAMPS FRAUD | STARBUCKS BARISTAS BIG MAD | MORE NEWS (AND NO REAL ESTATE!)
36.9K10 -
 LIVE
LIVE
Reidboyy
1 day ago $0.07 earned24/7 BO7 Camo Grind! Stream Doesn't End Until I Unlock EVERY Camo in Black Ops 7!
3 watching -
 2:27:02
TheSaltyCracker
3 hours agoTucker Blows Up FBI ReeEEStream 11-14-25
45.6K110 -
 LIVE
LIVE
I_Came_With_Fire_Podcast
12 hours agoThe Private Equity Crisis | Oh SNAP, Massive Fraud | Reindustrialization
193 watching -
 1:36:12
Glenn Greenwald
9 hours agoQ&A With Glenn: On the Epstein Emails; Chomsky's Friendship with Epstein; Differences Between Tucker Carlson and Nick Fuentes; the Babylon Bee's Attack on Megyn Kelly; and More | SYSTEM UPDATE #547
91.2K48