Premium Only Content

RSI Divergence Trading Strategy
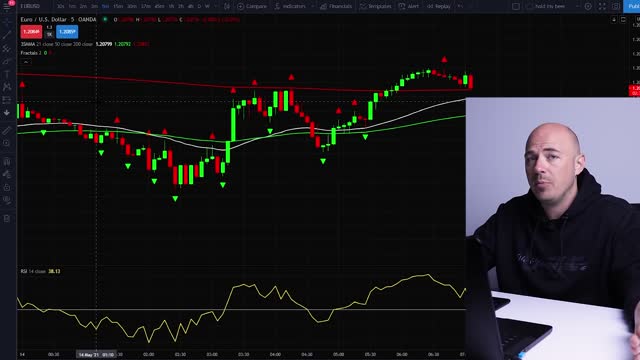
An RSI Divergence trading strategy will help you find the best possible entry for your trade when used correctly. RSI Divergence or Relative Strength index Divergence shws traders a loss of momentum and suggests the price will go the opposite direction. When looking for an RSI Divergence it is important to no that depending on the momentum of the price action it may continue in that direction before fully reversing.
The trading floor is a new project that I just launched.
World class day trading education and tools
https://www.trdfloor.com/
my twitter https://twitter.com/artybryja
For charts Use Trading View
https://www.tradingview.com/?aff_id=1...
New Official Telegram Group
TMA OFFICIAL®
https://t.me/TMAbyArty
Looking for a forex broker?
I use Osprey
https://ospreyfx.com/tradewithtma
regulated broker i recommend is Blueberry markets
https://bit.ly/blueberrytma
Try a $100,000 funded account from OspreyFX
https://ospreyfx.com/tradewithtma
Use coupon code
movingaverage50
To get $50 off
or try FTMO
https://ftmo.com/en/?affiliates=2677
Get a free audio book from audible
https://tmafocus.com/2WyXSqa
Links to the indicators
TMA Overlay
https://www.tradingview.com/script/zX...
TMA Divergence indicator
https://tmafocus.com/3nfcEfd
TMA shop
https://shop.spreadshirt.com/themovin...
Get some free stocks from WEBULL
https://tmafocus.com/3p0vatP
also
Get some free stocks from Public
https://tmafocus.com/3GUUojh
Trading Platform
META TRADER 4
Using divergence is a popular way to identify potential trading opportunities. But how does it work and when does it stop working?
RSI Divergence occurs when the Relative Strength Index indicator starts reversing before price does. A bearish divergence consists of an overbought RSI reading, followed by lower high on RSI. At the same time, price must make a higher high on the second peak, where the RSI is lower. In a bullish divergence situation, there must be an oversold condition on the RSI, followed by a higher low on the RSI graph. Simultaneously, price must form a lower low on the second peak.
NOT FINANCIAL ADVICE DISCLAIMER
The information contained here and the resources available for download through this website is not intended as, and shall not be understood or construed as, financial advice. I am not an attorney, accountant or financial advisor, nor am I holding myself out to be, and the information contained on this Website is not a substitute for financial advice from a professional who is aware of the facts and circumstances of your individual situation.
We have done our best to ensure that the information provided here and the resources available for download are accurate and provide valuable information. Regardless of anything to the contrary, nothing available on or through this Website should be understood as a recommendation that you should not consult with a financial professional to address your particular information. The Company expressly recommends that you seek advice from a professional.
*None of this is meant to be construed as investment advice, it's for entertainment purposes only. Links above include affiliate commission or referrals. I'm part of an affiliate network and I receive compensation from partnering websites. The video is accurate as of the posting date but may not be accurate in the future.
-
 2:08:03
Roseanne Barr
5 hours ago"Neuralink Is The Mark Of The Beast" W/ Tom Althouse | The Roseanne Barr Podcast #105
162K48 -
 1:19:30
vivafrei
10 hours agoHappy 4th of July! Big Beautiful Bill PASSES! Diddy ACQUITTED! Canada's Demise Continues & MORE!
104K78 -
 8:52
8:52
Blackstone Griddles
8 hours agoQuick and Easy Summer Hot Dogs on the Blackstone Griddle
7.18K2 -
 9:35
9:35
Clownfish TV
14 hours agoNeil Druckmann Just QUIT The Last of Us...
5.62K7 -
 11:30
11:30
GBGunsRumble
4 hours agoGBGuns Range Report 04JUL25
7.11K1 -
 6:21:07
Dr Disrespect
9 hours ago🔴LIVE - DRDISRESPECT - LAND OF THE FREE. HOME OF THE TWO-TIME
144K13 -
 1:02:46
Badlands Media
15 hours agoMAHA News Ep. 49: The Patriot Games, RFK Throws CDC Under The Austim Bus, Medicaid Fraud
47K4 -
 LIVE
LIVE
Quite Frankly
1 day agoLiberty Weekend 1986 - Commercials And All!
358 watching -
 45:49
45:49
The Quartering
7 hours agoHasan Piker In HUGE Trouble, Near Disaster In The Sky!
151K34 -
 4:18:44
Donut Operator
9 hours agoCRIME/ HAPPY 4TH / MP7 IS MINE
96.4K12