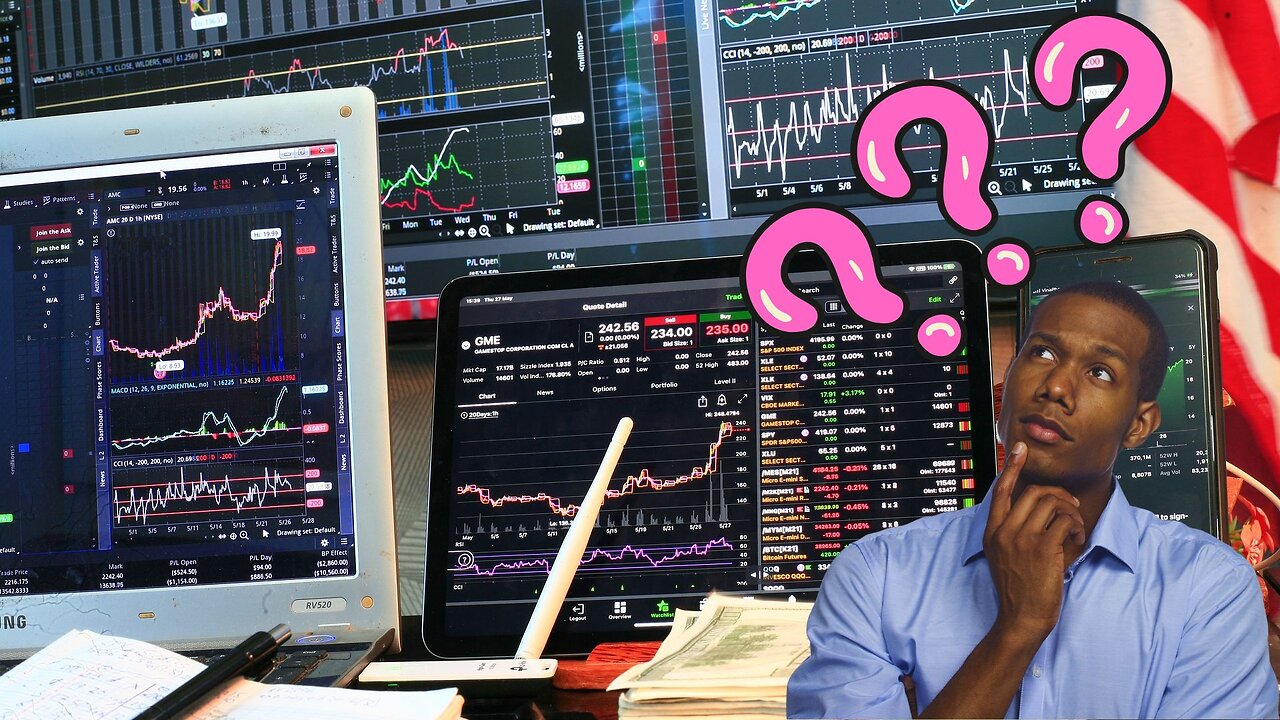
How to read a Chart and Candlestick for trading
2 years ago
1
One question i get asked a lot from people who start trading, is that they don't really know how to read the chart. Technical analysis is basically understanding the price, which the chart is build on. In this video i am giving you a very quick overview of the candlestick chart and time frames. Enjoy!
Instagram: https://www.instagram.com/jhny_handsome/
Twitter: https://twitter.com/JohnnyH52869325
---------------------------------------------------------------------
Tradinview: https://bit.ly/3Q5bDEs
#trading #daytrading #chartpatterns #chartanalysis
Loading comments...
-
 LIVE
LIVE
Joker Effect
1 hour agoSTREAMER NEWS: WHAT IS JOKER DOING?! Where is the streamer space going now?! Q & A
263 watching -
 LIVE
LIVE
Eternal_Spartan
4 hours ago🟢 Eternal Spartan Plays Arc Raiders - New Updates! | USMC Veteran
86 watching -
 LIVE
LIVE
CODZombieGod115
9 hours ago $0.04 earned🟢 Live - Ashes Of The Damned Round 100 Attemp or Easter Egg Attempt! Black ops 7 Zombies
39 watching -
 2:03:49
Mally_Mouse
1 day ago🔥🍺Spicy HYDRATE Saturday!🍺🔥-- Let's Play: Cuff Bust
37.7K2 -
 2:06:12
SavageJayGatsby
10 hours ago🔥🌶 Spicy Saturday – Cuff Bust Chaos! 🌶 🔥
27.8K -
 58:35
58:35
WanderingWithWine
4 days ago $4.93 earnedLive in FLORENCE ITALY for €80k? | 6 Houses For Sale in Italy
17.9K5 -
 1:02:05
Live From The Casita
2 hours ago $0.79 earnedLive Music Jam
7.87K -
 3:45
3:45
Gun Drummer
14 hours agoThree Days Grace - I Hate Everything About You (GUN COVER)
18.4K2 -
 LIVE
LIVE
DeadMomAlive
5 hours agoSatur-SLAY Face Paint! MEOW! ARC with da CREW! BIRTHDAY MONTH!
62 watching -
 3:04:12
Wokkopotamus
4 hours ago $1.35 earnedIts Random Saturday night come hang out with Wokko , Livestream !
12.9K