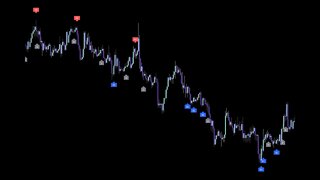
Beginners Guide to Reading Charts: What is a candle, what is a trend, and what is consolidation
2 years ago
In this video I give a brief explanation of what you see when you open a chart for the first time, and how to identify a trending market or a consolidated market.
#howtotradingview #beginnertrading #tradingforbeginners #forex #readingcharts #Beginnerguide
*all content in this video is for educational purposes only.
Loading comments...
-
 23:03
23:03
Scholar Trading
1 year agoBeginners Guide to reading Charts: Candle Patterns
1 -
 5:16
5:16
Ascencore
7 months agoLearn Continuation (Candle Charting Patterns): Example Case Study With MMM Stock Chart
16 -
 7:08
7:08
Ascencore
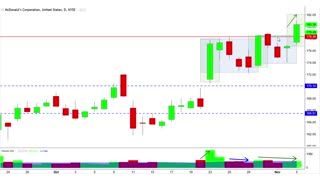
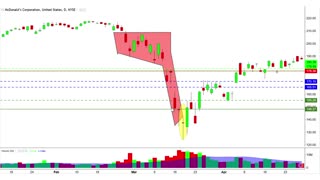
7 months agoUnderstanding Continuation Candle Charting Patterns: Example Case Study (MCD Stock Chart))
6 -
 5:27
5:27
Ascencore
7 months agoThe Basics Of How To Read Candlestick Patterns On Charts
15 -
 0:35
0:35
Ascencore
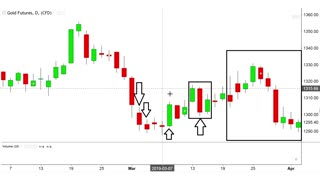
7 months agoCandlestick Charting Patterns Analysis With The Spinning Top Candles Example Case Study Gold Futures
15 -
 4:40
4:40
Ascencore
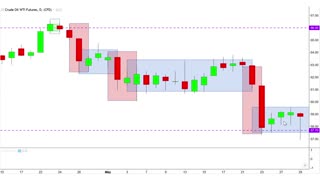
7 months ago(Continuation) Candlestick Charting Pattern Analysis: Example Case Study Crude Oil Futures Chart
15 -
 2:56
2:56
Ascencore
6 months agoLearn To Analyze Candlestick Charts By Combining Multiple Candles: Example Case Study QQQ Nasdaq ETF
12 -
 5:03
5:03
Ascencore
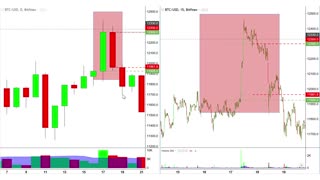
6 months agoCandle Chart Pattern Practice Example Case Study BTCUSD, Bitcoin Price Chart
21 -
 10:54
10:54
Ascencore
6 months agoAssorted Candle Chart Analysis (Practice Case Study) SNAP Stock Chart
36 -
 2:42
2:42
Ascencore
6 months agoVery Bearish (Candle Chart Patterns): Example Case Study With MCD Stock Chart
15