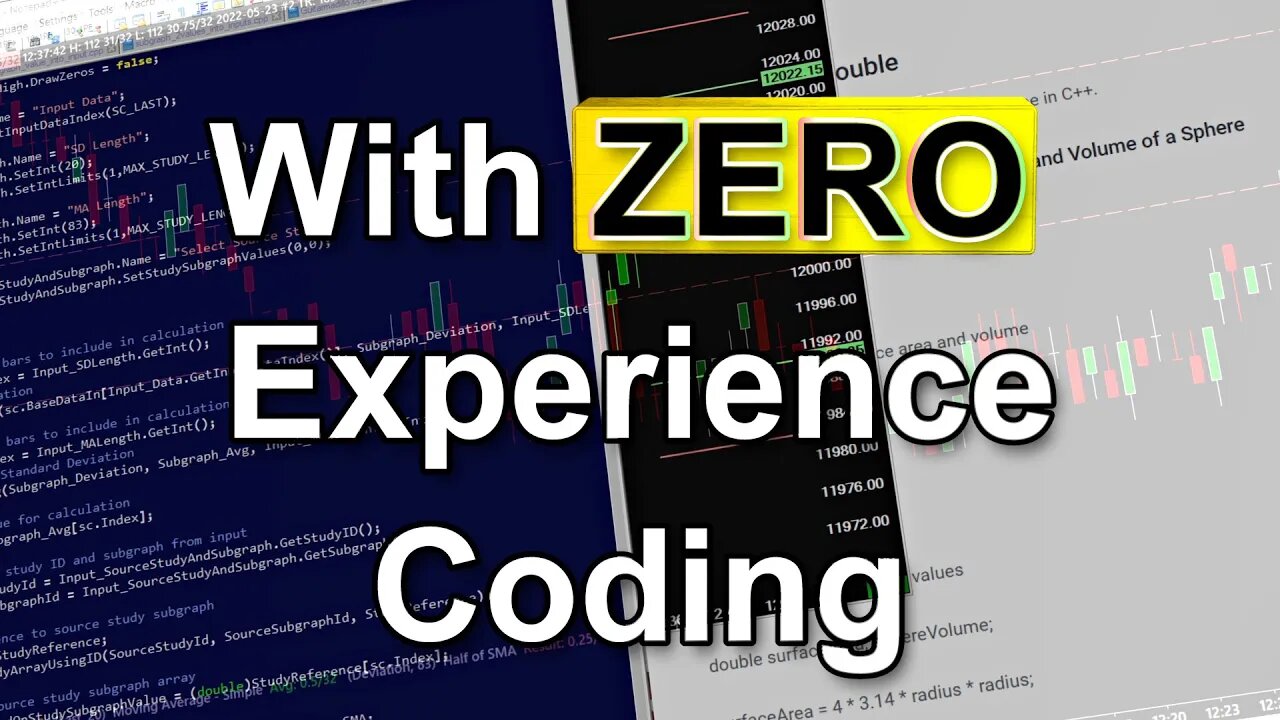
How we built a Custom C++ Indicator for Trading | Volatility Overlay
In this video we show how we created a custom study in Sierra Chart to do what was previously being done by 9 different studies combined on a chart. The first part of the video explains how we built this indicator first only using existing studies in Sierra Chart. The second part of the video goes through the code for the new study. This study is a component of a greater trading system and will likely serve as the backbone for an automated order management system in the future. This video is not a tutorial, it is more of a video we made to help solidify our understanding of certain things.
Broker used to Trade Stocks: 📈
https://www.InteractiveBrokers.com/mkt/?src=verrilloy4&url=%2Fen%2Findex.php%3Ff%3D1338
If this video helped you, clicking the link above helps support these videos. ↖️
Software used for Trading, Market Data & Automated Trading:
https://www.sierrachart.com
Broker used for Trading Futures:
https://www.ironbeam.com
Service used for Currency Conversion & Cross-Border Banking: 💸
https://Wise.prf.hn/l/vJ3lpxv
✅ Recommended Videos:
Sierra Chart Trading Interface: https://youtu.be/sIfd4tqKaOY
Basic tutorial for Custom C++ studies in Sierra Chart: https://youtu.be/bgOeFdrlukU
Sierra Chart Volume By Price: https://youtu.be/_IRGrmNlP4U
How to Practice Day Trading: https://youtu.be/LituIvbOnno
☑️ Recommended playlists:
TWS Tutorials: https://www.youtube.com/watch?v=PeLgfvPFPv8&list=PLePBf4ZtCKhq0cVloJ-a8FIS2XdAbjKzG
Trading Content: https://www.youtube.com/watch?v=x4vIvu3aVZA&list=PLePBf4ZtCKhpOPE9vq6Gj6WhLHiTZ9Wbw
Sierra Chart Videos: https://youtube.com/playlist?list=PLePBf4ZtCKhovGMhz0W0ksWC7Edqt02iX
Feel free to ask questions below. 📩
DISCLOSURE OF MATERIAL CONNECTION: VerrilloTrading may have an affiliate relationship and/or another material connection to any persons or businesses mentioned in or linked to in the content above, and may receive commissions from purchases you make on subsequent web sites. You should not rely solely on information published by VerrilloTrading to evaluate the product or service being offered.
Disclaimer: The content that this channel provides is intended for educational purposes only. Trading futures and options involves substantial risk of loss and is not suitable for all investors. Past performance is not necessarily indicative of future results. The risk of loss in trading commodity interests can be substantial. You should therefore carefully consider whether such trading is suitable for you in light of your financial condition.
#trading #futurestrading #coding
Timestamp
00:00:00 Introduction and context
00:00:59 Explaining how we first built it
00:03:01 The reference study
00:04:54 Add subtract study to plot on price scale
00:06:23 Study value into other study input
00:07:14 Divide SMA value and plot overshoot range
00:08:49 New study showing inputs and subgraphs
00:09:44 Explaining the code
00:10:56 Data start index function
00:12:05 Calculate standard deviation
00:13:18 Calculate SMA based on deviation
00:14:26 Some words around our process
00:15:40 Make reference to a source study on the chart
00:17:22 Make reference to source study subgraph array
00:19:19 Grab source study subgraph array
00:20:06 Calculate and plot subgraphs
00:21:40 Rundown of what the study is doing
-
 20:23
20:23
Neil McCoy-Ward
4 hours ago🚨 She Wasn’t Ready for This (TOTAL PUBLIC HUMILIATION!)
9.54K9 -
 18:46
18:46
ThinkStory
1 day agoIT: WELCOME TO DERRY Episode 5 Breakdown, Theories, & Details You Missed!
14.9K -
 2:23:05
Badlands Media
12 hours agoBadlands Daily – Nov. 27, 2025
113K35 -
 LIVE
LIVE
FusedAegisTV
7 hours agoFUSEDAEGIS | They Put A Freakin' Blue Mage In THIS | Expedition 33 PART V
178 watching -
 1:16:04
Rebel News
4 hours agoHealth-care collapsing, Bloc says Quebec sends Alberta $, US Ambassador's advice | Rebel Roundup
19.5K21 -
 1:44:03
The Shannon Joy Show
4 hours agoThe BEST Of Shannon Joy 2025! Special Thanksgiving Holiday Compilation
25.4K -
 1:07:25
Sarah Westall
20 hours agoSarah Westall is Not a Porn Star – Conversation w/ Stuart Brotman
18.8K13 -
 2:59:36
Wendy Bell Radio
12 hours agoPoint Blank Hate
88.8K113 -
 4:56:43
MrR4ger
9 hours agoWARLOCK SOLO SELF FOUND HARDCORE - D4RK AND D4RKER HAPPY TURKEY DAY RUMBLEFAM
24.8K1 -
 1:33:31
Barry Cunningham
17 hours agoBREAKING NEWS: KASH PATEL AND DOJ HOLD PRESS CONFERENCE UPDATE ON NATIONAL GUARD ATTACK
130K79