Turning Stem and Leaf plots into Box plots w/ extras
2 years ago
198
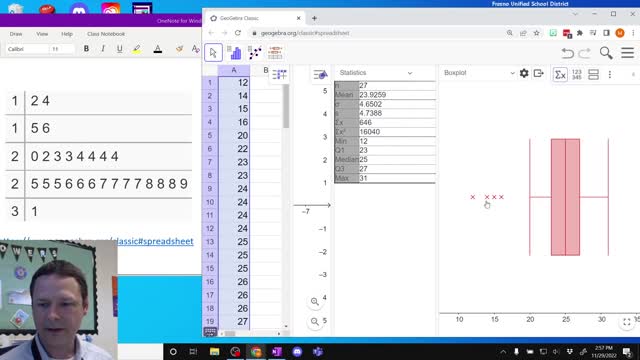
https://www.geogebra.org/classic#spreadsheet
Turning Stem and Leaf Plots into Box Plots. Also briefly go over finding the Standard Deviation, Five number Summary(Min,Q1, Med, Q3, Max), and interquartile range (Q3-Q1).
Loading comments...
-
 5:02
5:02
Bestietvx
3 years agoTurning Fear into Love
5.3K -
 0:06
0:06
dneom565
3 years agoMe turning my house into
13.7K -
 2:33
2:33
WMAR
3 years agoTurning a negative into a positive, posthumously
2 -
 30:19
30:19
churchforthenations
3 years agoTurning Barriers into Bridges
67 -
 6:30
6:30
JuryInvestigations
3 years agoTurning tragedy into TRIUMPH!
16 -
 1:18:29
The Fitness Oracle
3 years agoTurning Disability Into Ability
-
 0:47
0:47
Rey mendoza
3 years agoTurning my closet into a gun safe
4 -
 39:34
39:34
LarryDT
3 years agoTurning over a new leaf
2 -
 0:14
0:14
pepperpeep
3 years agoPutin Turning New Sanctions Into Christmas Decorations
24 -
 8:05
8:05
Xiaoisme
3 years agoTurning boys into girls
7