Premium Only Content
This video is only available to Rumble Premium subscribers. Subscribe to
enjoy exclusive content and ad-free viewing.

Maricopa County Voter Turnout Data 2022
1 year ago
1
2022 midterms
Arizona
AZ
stolen election
Kari Lake
Katie Hobbs
Maricopa County
voting machines
voter fraud
fake victory
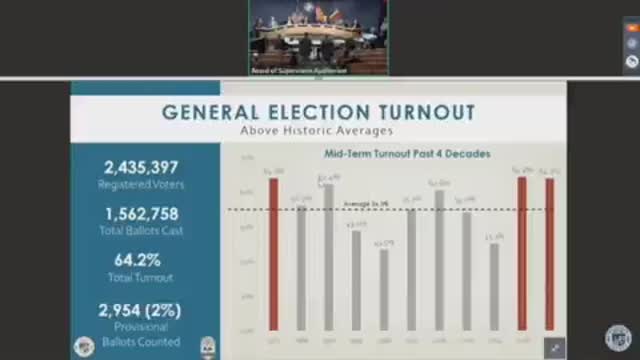
In 2022, according to Maricopa County:
75.4% of Republicans turned out, up from 2018
68.5% of Democrats turned out, down from 2018
There are more registered Republicans (1,436,852) than Democrats (1,270,544) in AZ
Yet...no GOP candidate benefited (Except the treasurer!😂)
Loading comments...
-

Russell Brand
1 hour agoLara Logan EXPOSES the Media's Hidden Agendas & Power Plays – SF499
27.7K31 -
 LIVE
LIVE
checkmate7_7
6 hours ago $0.26 earnedSlammin Apex clams | !GUILDED
357 watching -
 LIVE
LIVE
RonjnJeremy
3 hours ago $0.25 earnedClassic Wow 20th Anniversary edition HC PT 2 Seemless...Orc to troll...Still Shaman
362 watching -
 LIVE
LIVE
The Charlie Kirk Show
1 hour agoMatt Gaetz Speaks + Why Dems Lose the Bathroom Battle + Shut Down The Education Cartel | 11.22.24
13,033 watching -
 LIVE
LIVE
The Dilley Show
1 hour agoAmerica's Mayor, AG Pam Bondi and Q&A Friday! w/Author Brenden Dilley 11/22/2024
3,672 watching -
 LIVE
LIVE
Grant Stinchfield
1 hour agoRepublicans are a Greater Threat To Trump's Presidency than the Democrats
594 watching -
 1:00:50
The Dan Bongino Show
5 hours agoA Massive Shake Up On The Trump Transition (Ep. 2376) - 11/22/2024
581K1.24K -
 32:04
32:04
Stephen Gardner
17 hours ago🔥This Has GONE TOO FAR! Putin Begs Trump to intervene to avoid WW3!!
22.3K46 -
 1:01:56
Dr. Eric Berg
3 days agoThe Dr. Berg Show LIVE November 22, 2024
17.5K1 -
 55:10
55:10
The Rubin Report
2 hours agoPiers Morgan May Never Have This Guest on Again After This Fight
36.9K38