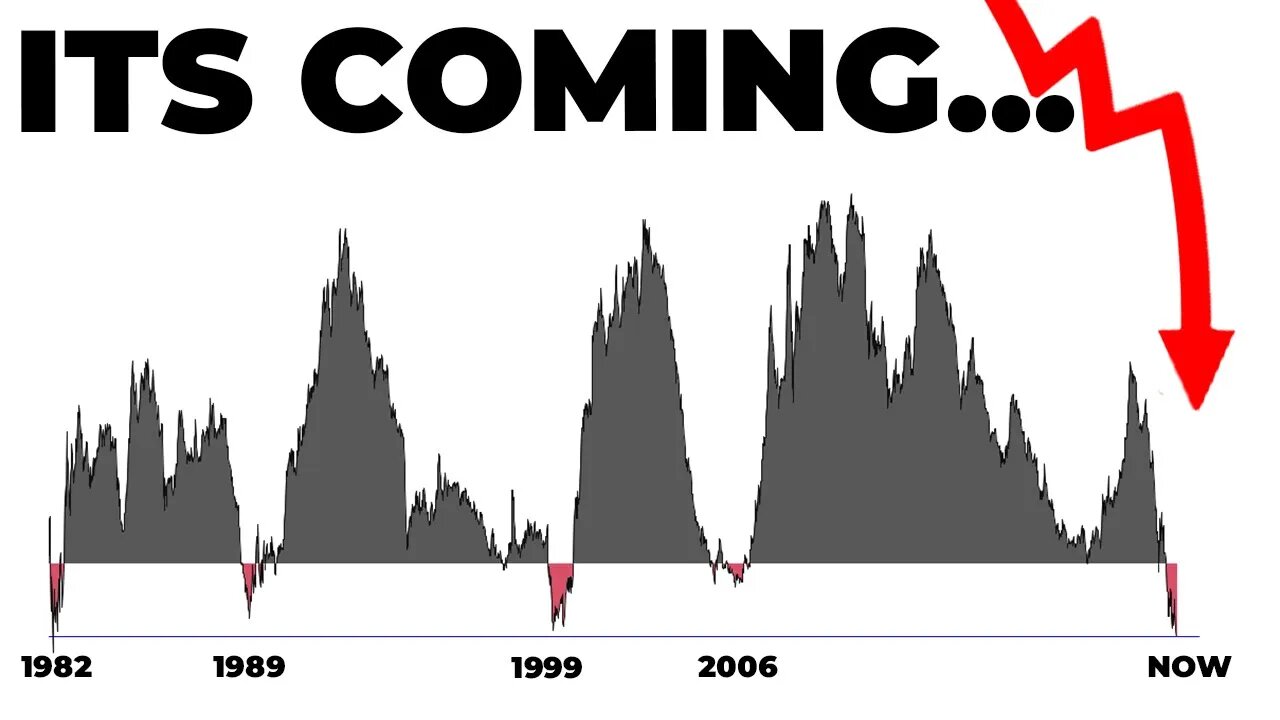
NOT Seen Since 1982! 👀
🟢 TRADE IDEAS & DISCORD: https://www.patreon.com/figuringoutmoney
🟢 TRADE STOCKS WITH IBKR: https://bit.ly/3AOcvYo
🟢 Instagram: https://www.instagram.com/figuringoutmoney
🟢 Twitter: https://twitter.com/mikepsilva
______________________________________________________________________________________________
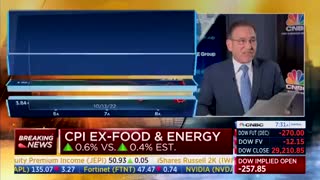
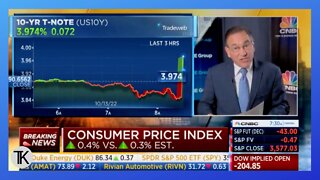
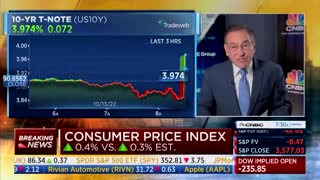
We haven't seen this yield curve deeply inverted since 1982. This tends to be the best recession indicator there is. Is there more pain for the stock market, it's hard to belive with the market rallying hard on a lower than expected CPI and PPI number. In today's video I discuss key levels and indicators to watch.
______________________________________________________________________________________________
How To Predict How Far Stocks Can Go (EXPECTED MOVES):
○ https://youtu.be/JT32L89ZpEk
Saylor To Schiff Bitcoin Indicator:
○ https://youtu.be/zuG9Tjnud9k
Show Me The Money Scan:
○ https://youtu.be/dzRjEuUUb5g
Party Starter Scan:
○ https://youtu.be/zzaN91gcJOI
Bouncy Ball Scan:
○ https://youtu.be/7xKOo6vNaq8
Dark Money Scan:
○ https://youtu.be/ZUMuHaSg1ro
Sleepy Monster Scan:
○ https://youtu.be/C9EQkA7uVU8
High Volatility Scan:
○ https://youtu.be/VC327ko8DfE
______________________________________________________________________________________________
DISCLAIMER: I am not a professional investment advisor, nor do I claim to be. All my videos are for entertainment and educational purposes only. This is not trading advice. I am wrong all the time. Everything you watch on my channel is my opinion. Links included in this description might be affiliate links. If you purchase a product or service with the links that I provide I may receive a small commission. There is no additional charge to you! Thank you for supporting my channel :)
-
 20:11
20:11
Figuring Out Money
1 year agoLet's Get Ready To Rumble!
32 -
 0:19
0:19
Terrence K Williams
2 years agoInflation Hits Highest Mark Since 1982
100 -
 0:19
0:19
Tony Katz
2 years agoCNBC’s Santelli: Core Inflation Highest Since 1982
48 -
 0:19
0:19
The Post Millennial Live
2 years agoCore US inflation is at its highest since 1982!
1348 -
 0:19
0:19
DC Enquirer
2 years agoInflation Has Hit Its HIGHEST Since 1982
192 -
 21:29
21:29
mmac0822
2 years agoA FATHERS LOVE: 126 DAYS SINCE I SEEN MY SON
3 -
 24:23
24:23
mmac0822
2 years agoA FATHERS LOVE: 120 DAYS SINCE I SEEN MY SON
-
 9:44
9:44
EricKrownCrypto
2 years agoBitcoin Hasn't Seen This On Price Since 2018
36 -
 2:46
2:46
aminenezzar
2 years agoChristian McCaffrey accomplishes amazing feat not seen since 2005 in 49ers win
10 -
 0:35
0:35
mmac0822
2 years agoA FATHERS LOVE: 126 days since I seen my son #shorts
5