EasyLanguage Tutorial 185 | Changing the TradeStation DataTip when hovering over drawing objects
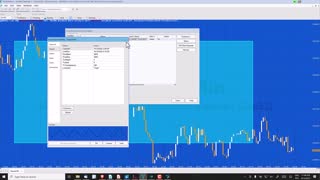
Tutorial 185 is built around a TradeStation EasyLanguage PaintBar study (_Tutorial185-Paintbar) that analyzes a chart searching for rectangles that have been drawn by the user using the chart drawing tools. The program modifees the datatips dialog to add the values of the number of bars in the rectangle and the price difference between the upper price and lower prices in the rectangle. These values are only displayed when hovering over bars that are encompassed by the rectangle. The same techniques could be modified and used with other drawing objects to display other values.
The paintbar study includes a method called PlotVals( ). This method goes through the rectangles on the chart and extracts the information that needs to be plotted. It stores it in Appstorage with the key values being the number of each bar within the rectangle being analyzed. The method then throws and exception which causes the program and the data to be reloaded. The method runs when a rectangle drawing object is created or clicked. The method uses another Method (DTtoBN) to convert Datetime values to Barnumber.
In this program the exception is thrown using a macro called using Runcommand. This requires that the ‘Enable runcommand EasyLanguage keyword…’ check box is selected in the format-analysis dialog box. See Quicktip 53 for information about using RunCommand and this macro: https://markplex.com/free-tutorials/tradestation-easylanguage-quicktips/quick-tip-53-how-to-modify-tutorial-116-to-reload-the-data-at-intervals/
For every bar on the chart the program checks to see whether there is a value stored in AppStorage for that bar, if so the number of bars in the rectangle and the price difference between the top and bottom of the rectangle are parsed using a TokenList and then plotted.
Appstorage
==========
AppStorage is a Dictionary of name-value pairs that is persistent when an analysis technique is re-verified, has its
inputs modified, or re-runs for another reason (such as when it is disabled by the user temporarily, and then enabled again). This means that when the exception is thrown the values persist in the Appstorage and can be plotted.
Values that are stored in AppStorage are saved when the workspace is saved.
More information can be found about Appstorage in Tutorial 119. See https://markplex.com/free-tutorials/tutorial-119-storing-chart-data-appstorage/
For more information about this tutorial, visit: https://markplex.com/free-tutorials/tutorial-185-changing-the-tradestation-datatip-when-hovering-over-drawing-objects/
-
 10:22
10:22
Markplex
1 year agoEasyLanguage quick-tip 82 | 'selecting' bars using a drawing tool
19 -
 4:34
4:34
Markplex
2 years agoTutorial 180 | Text Objects Basics | Part 1
2 -
 15:11
15:11
3D Printing Professor
7 years agoAdding 2D drawings to 3D objects in Tinkercad
3 -
 7:14
7:14
Unleash your inner trader with Team NakedTrader!
1 year agoHow to organize chart on TradingView by using the Object Tree - NakedTrader-serie TradingView #03
4 -
 24:07
24:07
Programming Mql4 Tools of the Trade
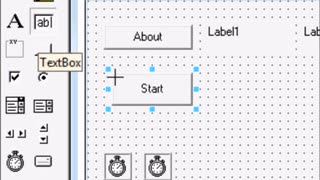
2 years agoMaking Hover Buttons With Objects
34 -
 0:28
0:28
Arts and Paint Channel
1 year agoColor Change Markers Simple Drawing Art 2023
1 -
![AutoCAD|ACAD|Civil 3D - Customize Shortcut Commands in Edit Aliases [5-Minute Tutorial]](https://hugh.cdn.rumble.cloud/s/s8/1/6/1/y/5/61y5c.0kob-small-AutoCADACADCivil-3D-Customi.jpg) 4:38
4:38
QuickSaveProductions
2 years agoAutoCAD|ACAD|Civil 3D - Customize Shortcut Commands in Edit Aliases [5-Minute Tutorial]
81 -
 10:47
10:47
1001 Unfinished Projects
1 year agoLearn Visual Basic 6 VB6 -101- Tutorial Project 1 Part 3
11 -
 9:01
9:01
Mahogany Lore
6 months agoVisualizing Data for Libraries: Part 4 - Symbol Map
1 -
 6:18
6:18
Day Trading Cryptos
3 months agoHow to insert Pine Script trading strategies onto TradingView charts
57