TEMPERATURE TREND LINES WITH WEATHER DOT GOV NUMBERS
1 year ago
10
temp trend lines created in excel with weather dot gov numbers...monthly summarized data temp trends avg and max for Denver, San Fran, Napa Valley, San Diego, Alaska and Miami.. not necessarily in that order. Let me know which data set you want me to plot if you dont know how to use excel and I would like to compare because the max temps have been higher than i see in this dataset...esp for areas like San Fran and the rest of the west coast. I encourage to plot any other temperature data sets you think are reliable.. climate change is real and those who deny it still think theyre going to strike oil in their backyard one day i guess.
Loading 1 comment...
-
 0:49
0:49
AfricanNewsAgency
2 years agoDurban Easter Weather & Emergency numbers
86 -
 3:02
3:02
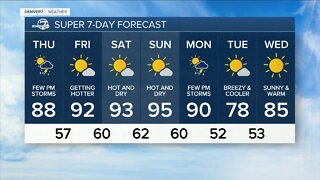
KMGH
2 years agoDry weather on the way with a big warming trend!
21 -
 3:25
3:25
Minute Math
2 years agoMultiply Two Numbers with Lines | Multiple Examples | Minute Math Tricks #mathtricks
11 -
 0:51
0:51
WSYM
2 years agoToday's Forecast: Warmer temperature trend continues into the weekend
1 -
 0:51
0:51
WSYM
2 years agoToday's Forecast: Warmer temperature trend continues into the weekend
1 -
 0:50
0:50
Minute Math
2 years agoMultiply Two Numbers with Lines | 51x12 | Minute Math Tricks | Part 90 #shorts
16 -
 0:44
0:44
Minute Math
2 years agoMultiply Two Numbers with Lines | 13x31 | Minute Math Tricks | Part 89 #shorts
10 -
 0:45
0:45
Minute Math
2 years agoMultiply Two Numbers with Lines | 21x15 | Minute Math Tricks | Part 88 #shorts
5 -
 0:45
0:45
Minute Math
2 years agoMultiply Two Numbers with Lines | 37x11 | Minute Math Tricks | Part 87 #shorts
6 -
 0:42
0:42
Minute Math
2 years agoMultiply Two Numbers with Lines | 14x22 | Minute Math Tricks | Part 86 #shorts
7