How to Read Candlesticks for Beginners (Patterns Included!)
How to Read and Understand Candlesticks
https://successacademycourses.com/how-to-read-and-understand-candlesticks/
The Ultimate Technical Analysis Stock Market Course:
USE CODE: "SUCCESS" For 75% off!
https://www.udemy.com/course/tsaultimatechartanalysis/learn/?couponCode=SUCCESS
Introduction: 0:00-0:09
Disclaimer: 0:09-0:12
What Are Candlesticks? 0:12-0:30
Parts of a Candlestick: 0:30-1:37
Timeframes: 1:37-2:08
Types of Candlesticks: 2:08-2:30
Support and Resistance: 2:30-2:59
Head and Shoulders Pattern: 2:59-3:22
Pipe Tops and Bottoms: 3:22-4:11
Types of Individual Candlesticks: 4:11-4:15
Shooter Candlesticks: 4:15-4:27
Hammer Candlestick 4:27-4:39
Doji Candlestick: 4:39-4:51
Inside Bar Candlestick: 4:51-4:59
Consolidation: 4:59
Candlesticks are a Japanese invention thought to be developed by Munehisa Homma. Candles are used in technical analysis to identify trends and patterns in a company’s stock in more detail than just a regular line chart. They represent the emotions of traders and a more detailed look at a stock’s price.
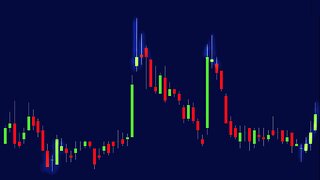
For most charts, the green candlestick is considered bullish and the red candlestick is considered bearish. These candles can sometimes also be shown as white and black.
Quick Notes:
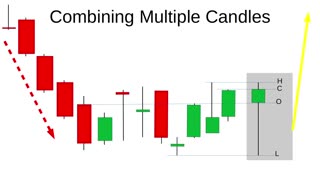
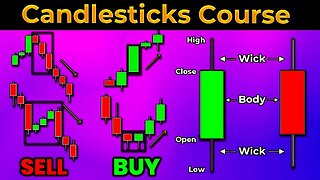
Parts of the candlestick include the body, the wicks, the high, the low, the open, and the close.
There are bullish and bearish candlesticks.
A bullish candle becomes bullish when the close price is higher than the open price, representing an increasing price.
A bearish candle becomes bearish when the close price is lower than the open price, representing a decreasing price.
-
 5:27
5:27
Ascencore
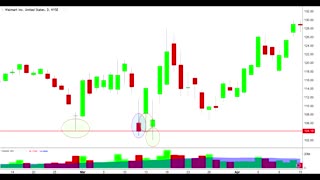
7 months agoThe Basics Of How To Read Candlestick Patterns On Charts
15 -
 2:31
2:31
Ascencore
6 months agoThe Basics Of Combining Multiple Candlestick Patterns For Beginners
25 -
 38:24
38:24
The God Of Trading
1 year agoULTIMATE Candlestick Patterns Trading Guide *EXPERT INSTANTLY*
33 -
 9:06
9:06
SonDaniel Crypto
5 months ago $0.10 earnedUnderstanding Candlesticks for Beginners!
60 -
 25:24
25:24
vektor21
1 year agoThe Perfect Beginner Candlestick Pattern That Actually Works... (Become A Pro Instantly)
2 -
 2:12
2:12
Ascencore
7 months agoIntroduction To Candlestick Pattern Charting
18 -
 1:06
1:06
Ascencore
6 months agoCandlestick Charting Patterns: Tips And Practice Project
25 -
 4:56
4:56
Ascencore
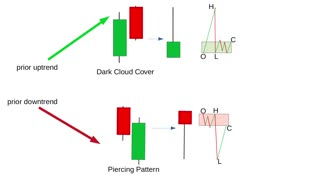
7 months agoEasy Candlestick Pattern Guide To Dark Cloud Cover, Piercing, & Kicking Candlestick Patterns
15 -
 6:23
6:23
Ascencore
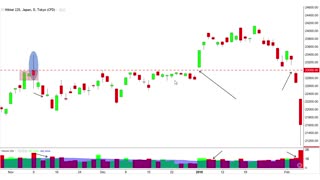
6 months agoPractice Candlestick Chart Patterns: Case Study Example Nikkei
24 -
 1:11:20
AdamMac1974
2 years agoThe ULTIMATE Beginners Guide to CANDLESTICK PATTERNS
16