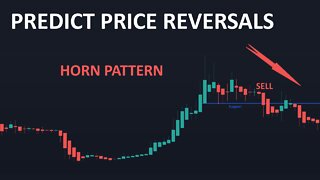
The POWERFUL REVERSAL Pattern You DON’T Know - Pipe Tops and Bottoms
1 year ago
20
Learn More Here: https://successacademycourses.com/pipe-tops-and-bottoms-chart-pattern/
The Ultimate Technical Analysis Stock Market Course: https://www.udemy.com/course/tsaultimatechartanalysis/learn/?referralCode=B3A9AFA5A79307F392B0
Introduction: 0:00-0:18
Disclaimer: 0:18-0:22
The Pipe Pattern: 0:22-0:50
Pipe Top: 0:50-1:45
Pipe Bottom: 1:45-2:40
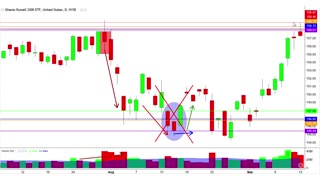
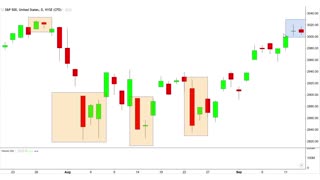
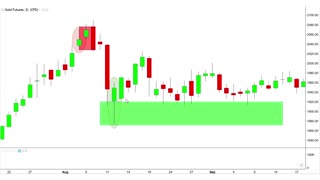
Chart Example: 2:40
The Pipe Tops and Bottoms pattern uses individual candlesticks to determine possible trading opportunities, which can occur on both daily and weekly charts. Yet, Pipe patterns on a weekly chart generally perform better than those on a daily chart.
It may seem similar to a Horn pattern as traders may execute trades based on levels of support or resistance.
Loading comments...
-
 4:02
4:02
The Success Academy
1 year agoPREDICT REVERSALS with ONE Chart Pattern - Horn Tops and Bottoms
68 -
 8:59
8:59
Ascencore
7 months agoTwo Candle Reversal Patterns Example Case Study With (F) Ford Stock Chart
3 -
 24:10
24:10
Ascencore
7 months agoReversal Candlestick Patterns With Three Candles Example Case Study (IWM ETF)
8 -
 5:54
5:54
Ascencore
7 months agoSingle Candlestick Reversal Example Case Study EURJPY Chart
15 -
 10:25
10:25
Ascencore
7 months agoSimple Candlestick Charting With Two Candle Reversal Patterns (Example Case Study (CADUSD Chart))
17 -
 13:34
13:34
Ascencore
7 months agoCandlestick Patterns Of Two Candle Reversal Patterns (Example Case Study SPX Chart)
13 -
 2:14
2:14
Ascencore
7 months agoCandlestick Patterns For Beginners: Three Candle Reversal (Example Case Study (Gold Futures Chart))
9 -
 3:07
3:07
Ascencore
7 months agoThree Candle Reversal Pattern Example Case Study JPY-USD Chart (Basic Candlestick Charting)
7 -
 15:21
15:21
Ascencore
7 months agoCandlestick Charting (Example Case Study WMT Stock Chart) Single Candle Reversal Patterns
10 -
 7:35
7:35
Ascencore
7 months agoCandlestick Charting Practice: Single Candle Reversal Example Case Study (CGX Stock Chart)
21