Parabolic SAR Indicator Secrets (3 Strategies to Profit in Bull and Bear Markets)
1 year ago
25
FULL ARTICLE: https://successacademycourses.com/how-to-use-the-parabolic-sar-3-killer-strategies/
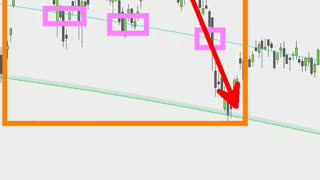
The Parabolic SAR indicator helps the trader determine the direction in which the security is moving, and helps determine possible reversals in the trend. It usually is shown with circles or stars, below the price in an uptrend, and above the price in a downtrend. The Parabolic SAR, developed by J. Welles Wilder Jr., stands for Parabolic “stop and reverse” because of its ability to identify potential reversals in price movement. This indicator is a popular choice for those who partake in scalping.
Learn Technical Analysis: https://www.udemy.com/course/tsaultimatechartanalysis/learn/?referralCode=B3A9AFA5A79307F392B0
Loading comments...
-
 5:22
5:22
The Success Academy
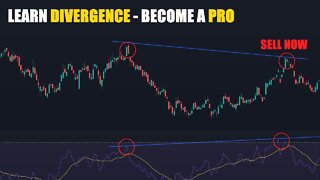
1 year agoBecome a PRO at Trading Divergence - Stock Market Strategy
39 -
 7:54
7:54
AndreJMcClendon
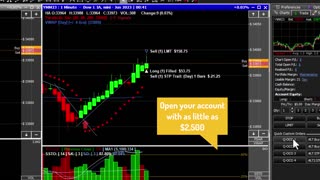
1 year agoParabolic SAR Indicator Trading Strategy With MQL4
61 -
 1:31
1:31
Grok Trade
11 months agoMarkets Are Bullish! But Watch For This... - Stock Market Technical Analysis
5 -
 14:11
14:11
TurnaMio
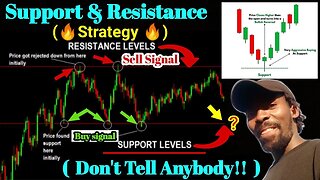
1 year agoSupport and Resistance Secrets: Powerful Strategies to Profit in Bull & Bear Markets
1 -
 6:08
6:08
Ascencore
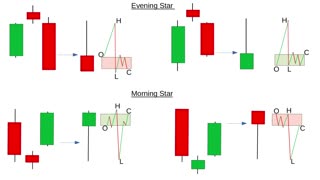
7 months agoHow To Analyze Bullish & Bearish (Engulfing), Evening, & Morning Star Candlestick Patterns
12 -
 11:01
11:01
Day Trade Recaps
1 year agoHow I Trade Bear Spreads
47 -
 2:00
2:00
LanTurner
1 year agoThe Power of the Bull Flag Trading Strategy
13 -
 8:47
8:47
Greg Secker - Learn To Trade
2 years agoHow To Use The Parabolic SAR Indicator For Maximum Results
6 -
 0:53
0:53
StockChartsTrading
2 years agoBull VS Bear Market Trading!
40 -
 9:48
9:48
TradingAcademy
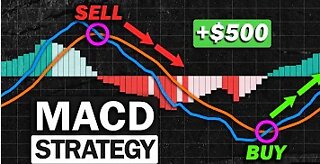
1 year agoMost Effective MACD Strategy for Daytrading Crypto, Forex & Stocks (High Winrate Strategy)
131