3 Chart Patterns Every Trader Should Know Article Video
GET YOUR FREE COURSE -- https://successacademycourses.com/free-course-sign-up/
Those who trade with technical analysis have identified chart patterns in the stock, usually with a candlestick chart. Technical analysts, those who study technical analysis, are able to use these chart patterns in an attempt to predict price movement.
Chart Patterns:
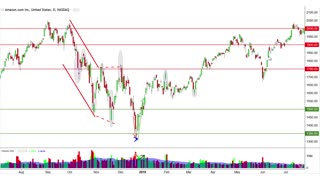
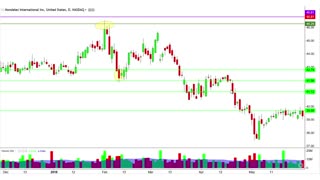
Head and Shoulders Pattern (And Inverted Head and Shoulders Pattern)
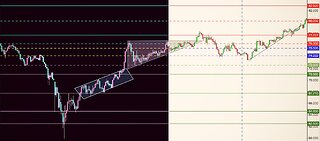
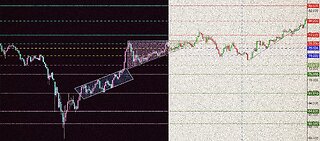
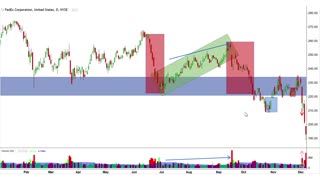
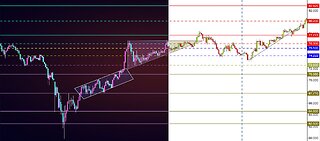
The Flag Pattern
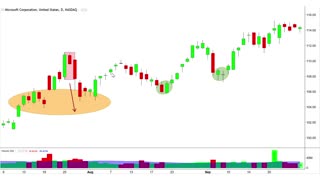
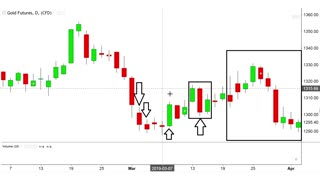
The Double Pattern (Double Tops and Double Bottoms)
Also support and resistance.
Watch more on support and resistance here: https://www.youtube.com/watch?v=alSRh2SB6fA&t=4s
Read the article: https://successacademycourses.com/3-chart-patterns-every-trader-should-know/
Read more on support and resistance: https://successacademycourses.com/what-is-support-and-resistance-a-complete-guide/
-
 7:22
7:22
Milgard
6 months agoHow To Find Trendlines On Cryptocurrency Charts BTC-USD Case Study
13 -
 10:28
10:28
Ascencore
5 months agoHarami (Candlestick Charting Pattern) Example Case Study With MSFT Stock Chart
12 -
 8:16
8:16
DayTradeToWin
2 years ago3 Price Action Chart Patterns Every Trader Should Know
19 -
 9:40
9:40
Ascencore
5 months agoAn Example Of Candlestick Charting Analysis With AMZN Stock Chart
17 -
 5:00
5:00
Ascencore
6 months agoTrading Channels Case Study (AMD) Stock Chart
18 -
 18:13
18:13
Ascencore
5 months agoCommon Candlestick Charting Pattern: The Harami (Example Case Study (FDX Stock Chart))
6 -
 6:26
6:26
Ascencore
6 months agoTechnical Analysis Of Channels Case Study (LYFT) Stock Chart)
13 -
 0:35
0:35
Ascencore
5 months agoCandlestick Charting Patterns Analysis With The Spinning Top Candles Example Case Study Gold Futures
15 -
 18:49
18:49
Ascencore
5 months agoExplaining Candlestick Charting Patterns With A Practice Case Study With MDLZ Stock Chart
14 -
 5:16
5:16
Ascencore
5 months agoLearn Continuation (Candle Charting Patterns): Example Case Study With MMM Stock Chart
16