Premium Only Content
This video is only available to Rumble Premium subscribers. Subscribe to
enjoy exclusive content and ad-free viewing.

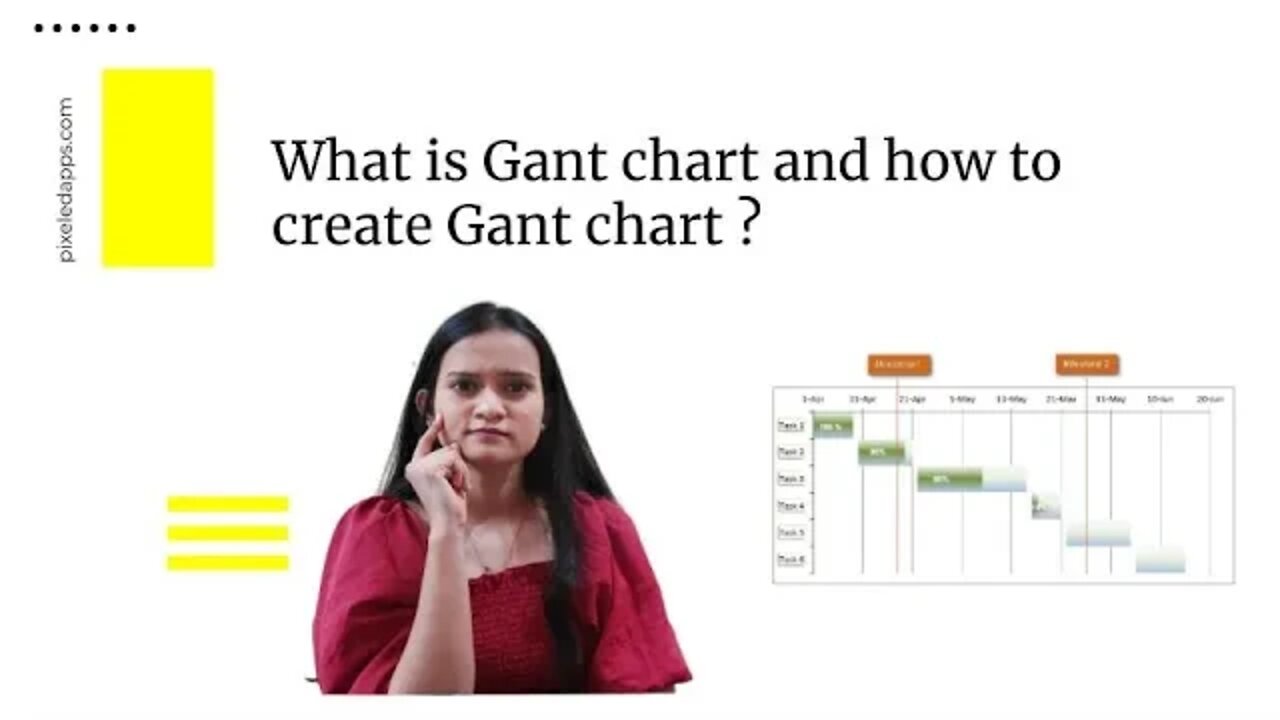
What is the Gant chart? and how to Create a Gant in Excel? | advantages and disadvantages|
3 years ago
10
A Gantt chart, commonly used in project management, is one of the most popular and useful ways of showing activities (tasks or events) displayed against time. On the left of the chart is a list of the activities and along the top is a suitable time scale. Each activity is represented by a bar; the position and length of the bar reflect the start date, duration, and end date of the activity.
Check out this wonderful book on project management: https://amzn.to/3IqA5w1
#Gantchart#gant#gant chart in PM#disadvantagesofgant#advantages of gantchart#project manager
Loading comments...
-
 48:58
48:58
World Nomac
15 hours agoWhat happens in the Philippines AFTER DARK 🇵🇭
8832 -
 40:28
40:28
Rethinking the Dollar
20 hours agoTrump’s 200 Executive Orders (421 total): What’s Next for America?
2.42K10 -
 1:48:38
The Criminal Connection Podcast
1 day ago $0.02 earnedYUSEF BOUATTOURA Pro PT: Mean Streets of TOTTENHAM, Belmarsh to Bootcamp! (CRAZY Life Story)
1.51K1 -
 10:33
10:33
Silver Dragons
15 hours agoDealer Reveals 2025 Silver and Gold Prediction, Goals, & MORE!
2.39K3 -
 1:08:13
Trumpet Daily
19 hours ago $3.70 earnedThe Return of 45 - Trumpet Daily | Jan. 20, 2025
4.56K6 -
 1:16:47
BIG NEM
1 day agoWe Interviewed a 40 Year Old VIRGIN
1.59K -
 2:54:30
Donald J. Trump
11 hours agoCommander-In-Chief Ball
368K291 -
 DVR
DVR
GOP
1 day agoPresident Trump Speaks at the Commander-In-Chief Ball
202K33 -
 1:45:10
Glenn Greenwald
13 hours agoTrump is Inaugurated & Immediately Issues Executive Orders; Biden Pardons His Family, Liz Cheney, Fauci; Michael Tracey DC Interviews | SYSTEM UPDATE #392
201K195 -
 2:03:43
Kim Iversen
13 hours agoTrump’s Triumphant Return: Breaking Down Trump’s Bold 2025 Agenda | The TikTok Ban Backlash: Who Wins, Who Loses?
131K77