What is the Gant chart? and how to Create a Gant in Excel? | advantages and disadvantages|
3 years ago
10
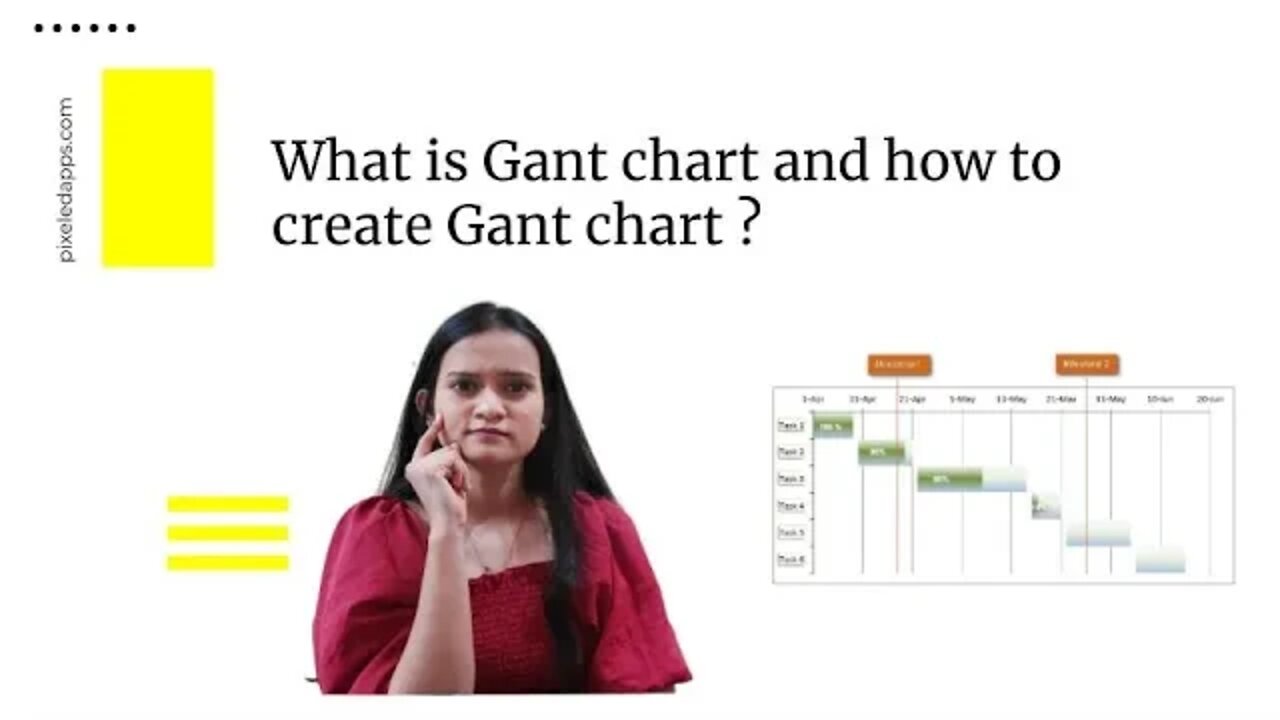
A Gantt chart, commonly used in project management, is one of the most popular and useful ways of showing activities (tasks or events) displayed against time. On the left of the chart is a list of the activities and along the top is a suitable time scale. Each activity is represented by a bar; the position and length of the bar reflect the start date, duration, and end date of the activity.
Check out this wonderful book on project management: https://amzn.to/3IqA5w1
#Gantchart#gant#gant chart in PM#disadvantagesofgant#advantages of gantchart#project manager
Loading comments...
-
 LIVE
LIVE
Game On!
19 hours agoThursday Night Football SHOWDOWN! Seahawks vs Cardinals Divisional CLASH!
13,862 watching -
 28:53
28:53
Clownfish TV
22 hours agoYouTube ADMITS They CENSORED Conservatives! What Else is Google Hiding?! | Clownfish TV
32.3K28 -
 40:15
40:15
NAG Daily
13 hours agoThe Rezendes Rundown Ep. 19 - Mad Bad Science
3.29K1 -
 31:57
31:57
Uncommon Sense In Current Times
16 hours ago $0.35 earnedThe DEI Housing Hoax | Dan Huff on Zoning, Manufactured Crisis & the War on Suburbs
10.4K1 -
 2:55
2:55
From Zero → Viral with AI
1 day ago $0.18 earnedAI Misconceptions: Why Small Businesses Hold the Real Advantage 🚀
3.08K -
 LIVE
LIVE
BEK TV
22 hours agoTrent Loos in the Morning - 9/25/2025
187 watching -
 2:39
2:39
The Official Steve Harvey
1 day ago $0.28 earnedThese books didn’t just change my mind, they changed my life. 📚💯
4.23K -
 1:35:35
Investigate Everything w/ Brian O'Shea
13 hours agoPart 1: "Evil & Logistics: Why is the Left So Good At Both” w/ Brian O’Shea & Bill Stebbins
8.1K1 -
 1:20:31
CharLee Simons presents DO NOT TALK
1 day agoR.I.P. MEDIA FREAKS
5.38K1 -
 16:39
16:39
Professor Nez
19 hours ago🚨PRICELESS: Trump Just EMBARRASSED Macron in New York
83.4K21