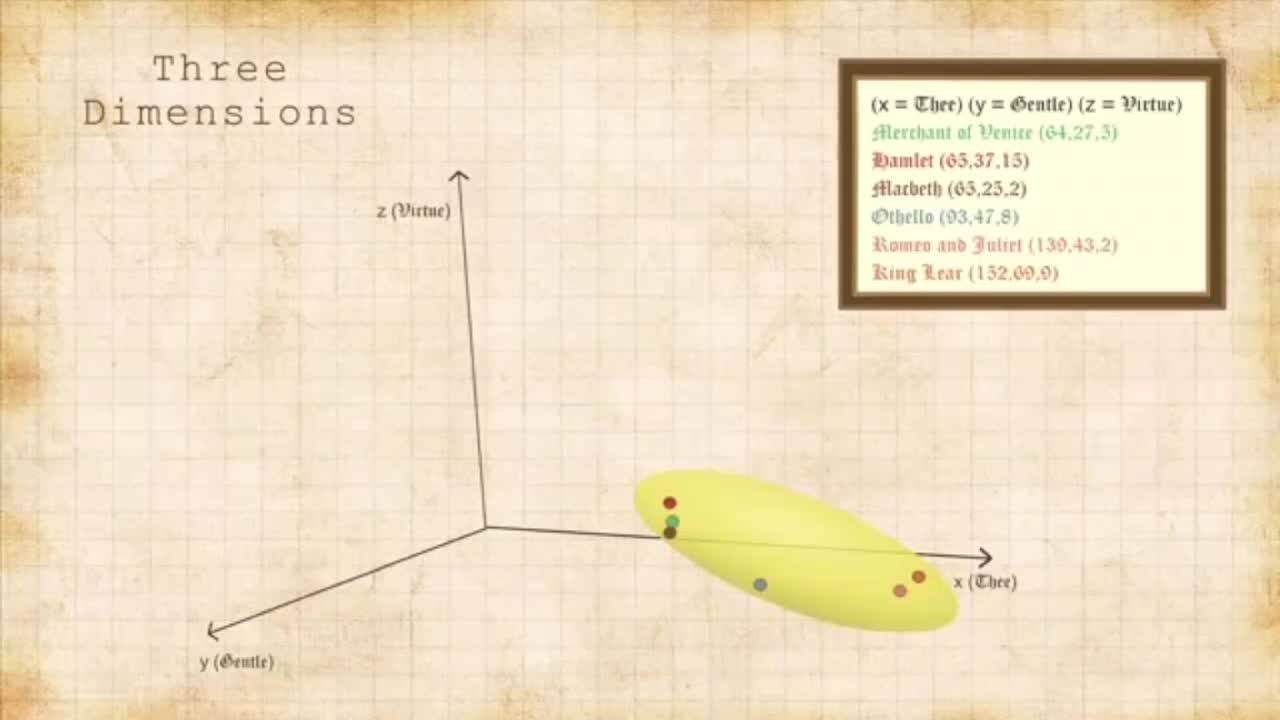
Principal component analysis
3 years ago
5.87K
Let's look at use of the word thee and visualize it as a dimension, or axis.Each of Shakespeare's works can be placed on that axis,like a data point, based on the number of occurrences of that word.In statistics, the tightness of these points gives us what is known as the variance,an expected range for our data.But, this is only a single characteristic in a very high-dimensional space.With a clustering tool called Principal Component Analysis, we can reduce the multidimensional space into simple principal components that collectively measure the variance in Shakespeare's works.
Loading comments...
-
 LIVE
LIVE
LFA TV
1 day agoLIVE & BREAKING NEWS! | MONDAY 10/6/25
700 watching -
 1:08:56
MTNTOUGH Podcast w/ Dustin Diefenderfer
11 hours agoJoby Martin: Calling Men to Biblical Manhood | MTNPOD #136
3.75K1 -
 LIVE
LIVE
LIVE WITH CHRIS'WORLD
5 hours agoLIVE WITH CHRIS’WORLD - Portland is a WARZONE | Chicago | Jay Jones | Bad Bunny | ANTIFA | and MORE!
187 watching -
 1:02:29
BonginoReport
4 hours agoIs Your Sombrero Getting Bigger or Are You Happy To See Me? - Hayley Caronia (Ep.149)
42.6K42 -
 LIVE
LIVE
Akademiks
2 hours agoDiddy Gets 4 Years 2 Months. Cardi B Responds to JT. Finesse2tymes Pressed? Streets is DONE?
1,207 watching -
 LIVE
LIVE
SpartakusLIVE
3 hours ago#1 King of Content brings MOTIVATION to the MASSES on Monday
115 watching -
 2:39:53
Nikko Ortiz
3 hours agoPTSD War Simulator | Rumble LIVE
7.01K -
 16:14
16:14
Sponsored By Jesus Podcast
1 day agoClocking in for Christ | How to Worship God With Our Careers
4.65K -
 1:02:36
Donald Trump Jr.
6 hours agoDon't Give Up The Ship, Plus Big City Dems Double Down on Delusion | Triggered Ep.280
73.6K88 -
 1:54:06
The Mike Schwartz Show
8 hours agoTHE MIKE SCHWARTZ SHOW Evening Edtion 10-06-2025
10.3K3
