Information cannot be judged without understanding the meaning of the scale
2 years ago
6.96K
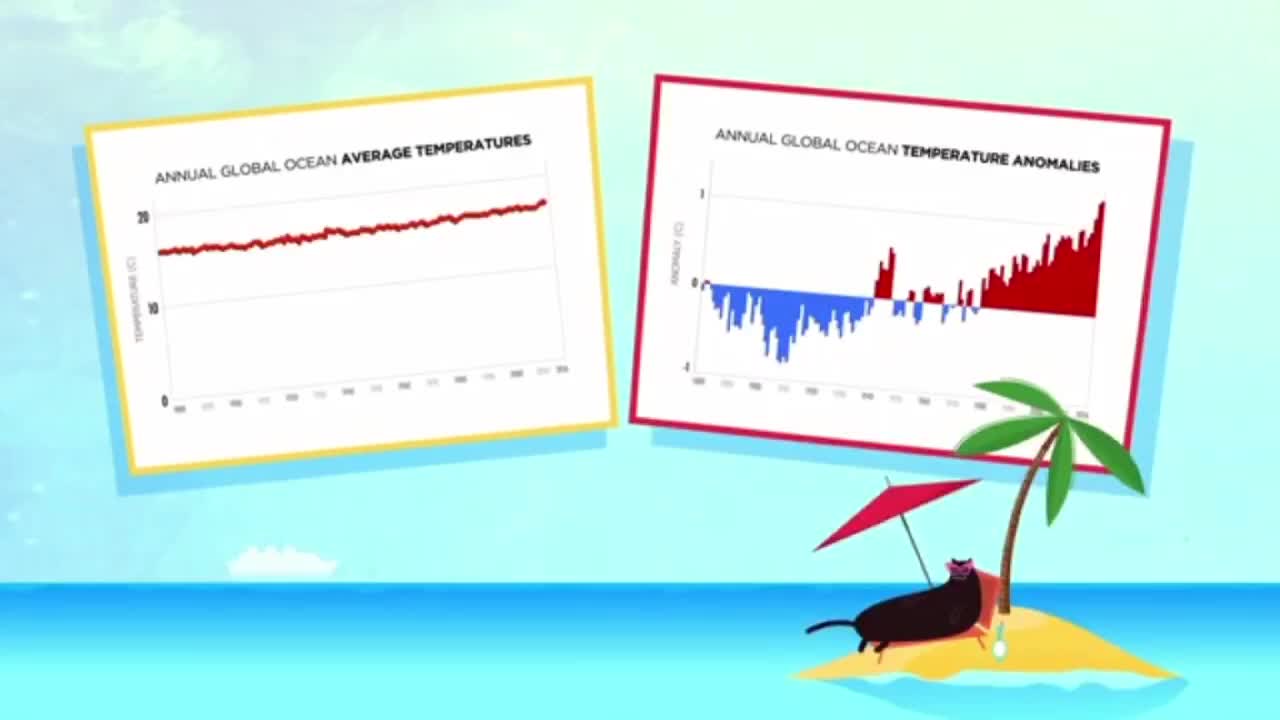
Finally, a graph can't tell you much if you don't know the full significance of what's being presented.Both of the following graphs use the same ocean temperature data from the National Centers for Environmental Information.So why do they seem to give opposite impressions?The first graph plots the average annual ocean temperature from 1880 to 2016,making the change look insignificant.But in fact, a rise of even half a degree Celsius can cause massive ecological disruption.This is why the second graph,which show the average temperature variation each year,is far more significant.
Loading comments...
-
 2:03:39
Pop Culture Crisis
3 hours agoWTF Happened to Miley Cyrus? HARRY POTTER Set Images, Sydney Sweeney Hater EXPOSED | Ep. 901
18.4K16 -
 10:17
10:17
MattMorseTV
4 hours ago $5.37 earnedTrump's DOJ just DROPPED a NUKE.
23.8K27 -
 LIVE
LIVE
Dr Disrespect
6 hours ago🔴LIVE - DR DISRESPECT - IMPOSSIBLE 5 CHICKEN DINNER CHALLENGE - FEAT. VISS
1,284 watching -
 11:07
11:07
Politibrawl
12 days agoRepublican rising star DESTROYS theatrical Democrat in front of the entire world
66.7K28 -
 DVR
DVR
StoneMountain64
4 hours agoOnly game with BETTER desctruction than Battlefield?
45.7K -
 4:51:37
Viss
6 hours ago🔴LIVE - Viss & Dr Disrespect Take on The 5 Win Minimum PUBG Challenge!
21.7K2 -
 LIVE
LIVE
sophiesnazz
2 hours ago $0.52 earnedLETS TALK ABOUT BO7 !socials !specs
40 watching -
 1:12:05
The Quartering
5 hours agoToday's Breaking News!
82.3K40 -
 8:20:24
GritsGG
8 hours agoWin Streaking! Most Wins 3390+ 🧠
53.6K2 -
 2:20:00
Tucker Carlson
5 hours agoDave Collum: Financial Crisis, Diddy, Energy Weapons, QAnon, and the Deep State’s Digital Evolution
121K107