Information cannot be judged without understanding the meaning of the scale
3 years ago
6.96K
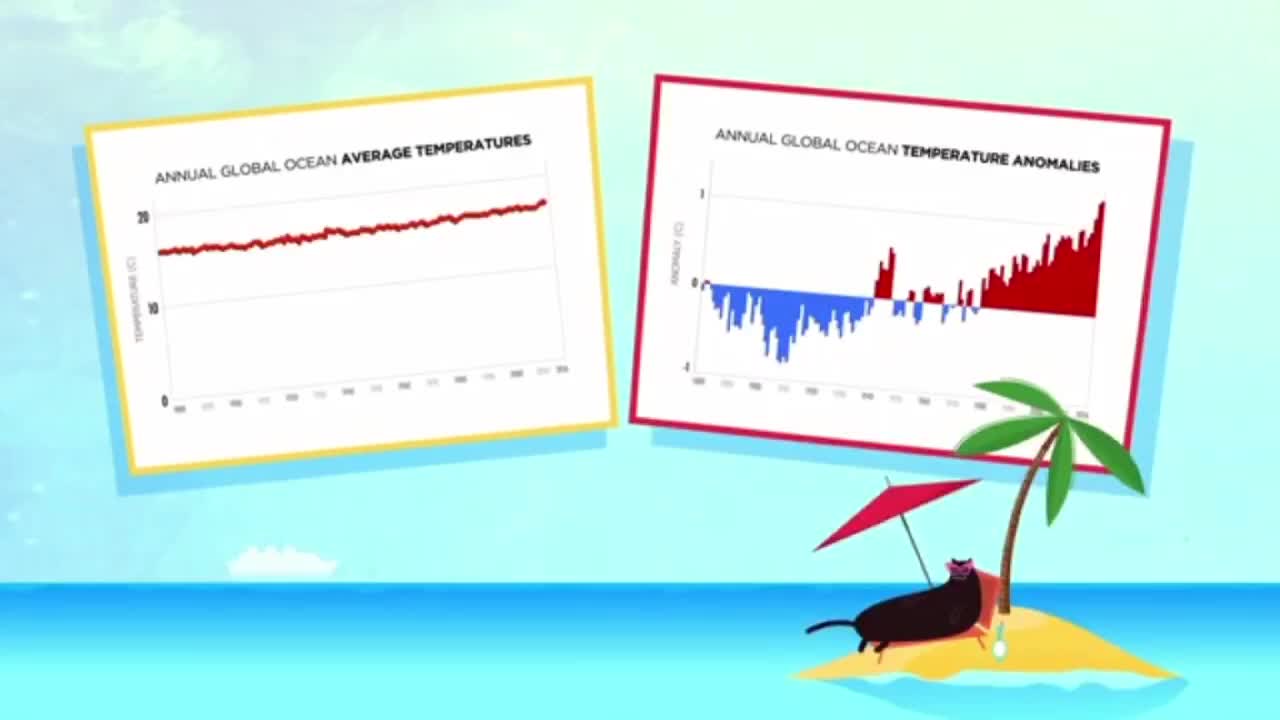
Finally, a graph can't tell you much if you don't know the full significance of what's being presented.Both of the following graphs use the same ocean temperature data from the National Centers for Environmental Information.So why do they seem to give opposite impressions?The first graph plots the average annual ocean temperature from 1880 to 2016,making the change look insignificant.But in fact, a rise of even half a degree Celsius can cause massive ecological disruption.This is why the second graph,which show the average temperature variation each year,is far more significant.
Loading comments...
-
 56:23
56:23
Coin Stories with Natalie Brunell
1 day agoLyn Alden: Bullish on Bitcoin & Hard Assets
4.44K -
 8:10
8:10
MattMorseTV
17 hours ago $10.35 earnedSchumer's PLAN just IMPLODED.
25.9K61 -
 2:11:52
Side Scrollers Podcast
19 hours agoYouTube ADMITS BLATANT Censorship + California Wants to FINE “Hate Speech” + More | Side Scrollers
77.1K15 -
 15:18
15:18
GritsGG
15 hours agoSweaty Quads w/ Bobby Poff!
18.5K5 -
 17:11
17:11
Nikko Ortiz
1 day agoIs Poverty Your Fault?
39.7K37 -
 1:25:15
The HotSeat
1 day agoIn Less Than Two Weeks, Here We Are Again.....
24.2K17 -
 12:55
12:55
The Pascal Show
13 hours ago $3.83 earned'THAT'S HIS GIRLFRIEND!' D4vd's Friends Speak Out Revealing They Thought Celeste Was His Girlfriend!
15K3 -
 LIVE
LIVE
Lofi Girl
2 years agoSynthwave Radio 🌌 - beats to chill/game to
276 watching -
 33:02
33:02
DeVory Darkins
9 hours ago $37.52 earnedComey INDICTED by grand jury in shocking announcement by DOJ as Trump claims MAJOR VICTORY
43.5K109 -
 2:06:23
Inverted World Live
10 hours agoEpstein Worked for CIA According to OMG Reporting | Ep. 114
142K42