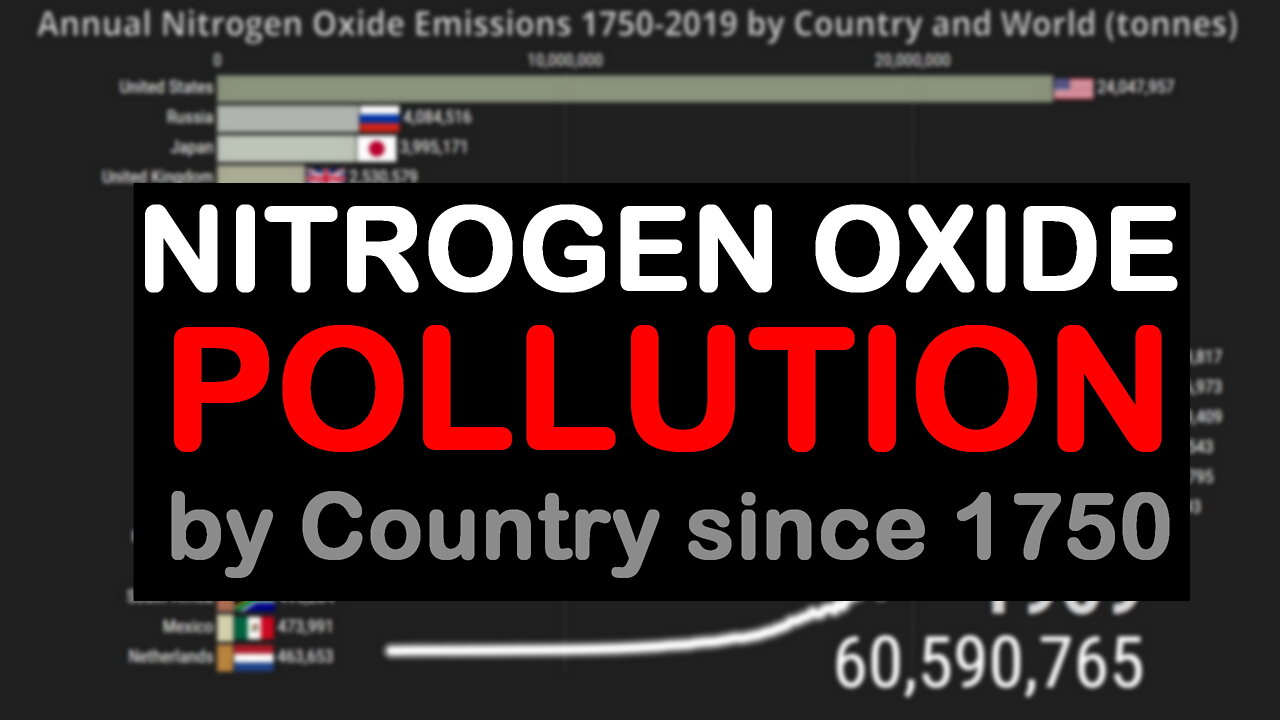
Nitrogen Oxide Pollutants since 1750 by Country and World
This bar chart race shows the annual nitrogen oxide (NOx) emissions by country, continents and world from 1750 to 2019, Measured in tonnes.
Numbers are shown as within moderne borders.
Only the year of each new decade is shown until 1800.
Source:
O'Rourke, P. R, Smith, S. J., Mott, A., Ahsan, H., McDuffie, E. E., Crippa, M., Klimont, S., McDonald, B., Z., Wang, Nicholson, M. B, Feng, L., and Hoesly, R. M. (2021, February 05). CEDS v-2021-02-05 Emission Data 1975-2019 (Version Feb-05-2021). Zenodo. http://doi.org/10.5281/zenodo.4509372.
Music:
Infinitely by Keys of Moon Music
https://soundcloud.com/keysofmoon
Music provided by www.plugnplaymusic.net
Special intro background effect by:
AA VFX: https://www.youtube.com/c/dvdangor2011/
Data visualization created with flourish.studio
-
 LIVE
LIVE
Game On!
15 hours agoTom Brady And The Las Vegas Raiders ARE BACK! 2025 NFL Preview!
5,041 watching -
 LIVE
LIVE
The Bubba Army
2 days agoShould RaJa Jackson Be Arrested? - Bubba the Love Sponge® Show | 8/25/25
2,540 watching -
 LIVE
LIVE
FyrBorne
14 hours ago🔴Warzone M&K Sniping: Builds So Strong They Think I'm Hacking
362 watching -
 LIVE
LIVE
BEK TV
2 days agoTrent Loos in the Morning - 8/25/2025
1,118 watching -
 4:23
4:23
Blackstone Griddles
16 hours agoEasy Salmon Dinner on the Blackstone Griddle
27.3K1 -
 8:10
8:10
WhaddoYouMeme
1 day ago $0.08 earnedChristians, Before You See “Testament”, Watch this!
7.36K4 -
 8:42
8:42
Freedom Frontline
15 hours agoDurbin’s Trump Smear Video Just HUMILIATED Him in the Senate
9.21K5 -
 10:56
10:56
ariellescarcella
13 hours agoThe Shocking Divide Among College Voters Sparks Worry For America
7.57K6 -
 13:09
13:09
Forrest Galante
11 hours agoWildlife Expert Reacts To Deadly Australian Animal TikToks
53.5K9 -
 12:08
12:08
Zoufry
2 days agoThe Mystery of Gaddafi's Final 24 Hours
21.8K12