![[ Part One ] Weekend US Market Analysis Feb 13-14/2016](https://1a-1791.com/video/s8/1/a/z/0/t/az0tf.qR4e-small--Part-One-Weekend-US-Market.jpg)
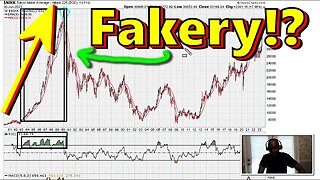
[ Part One ] Weekend US Market Analysis Feb 13-14/2016
LIKE | COMMENT | SHARE | SUBSCRIBE
My Website; http://www.muathe.com/
Original Muathe.com Concepts!
With monthly charts STILL looking bearish we should not be too surprised IF markets rally day to day (as they did in some world markets on Friday) yet even on smaller time frame charts we STILL see that the market is not out of trouble yet.
In simple terms world markets + US major indices are STILL bearish.
NASDAQ weekly below support @ 4,258.44, NASDAQ weekly, NASDAQ 5 Year weekly RSI support line from 2011, NASDAQ daily, NASDAQ hourly, Dow weekly 15,988.08, Dow, positive divergence, Dow 5 year weekly, Dow daily positive divergence plus back test line, Dow hourly support, Dow Transports hourly THREE RSI lines, Dow Transports long term monthly uniformity line backtest, SPX weekly support @ 1,881. 14, SPX weekly divergence, SPX daily below $1,859.33, SPX hourly, VIX monthly above $28.43, VIX $28.03 on the weekly, VIX hourly, SPX monthly, INDU 30 minute, SPX 30 minute, SPX 5 minute charts, NASDAQ monthly below 4,620.17, INDU monthly below 16,284.70, and SPX below $1,920.03 remains bearish.
-
 2:31
2:31
Muathe.com
2 years ago $0.01 earned🟢 Manipulated Stock Market Bubbles & Crashes!?
132 -
 10:57
10:57
China Uncensored
4 hours agoTurns Out The Iran Conflict Isn't Over...
8704 -
 LIVE
LIVE
Jamie Kennedy
2 hours agoCandace Owens Destroys Modern Feminism (and It Gets Worse From There) | EP 212
90 watching -
 38:26
38:26
Donald Trump Jr.
2 hours agoThis 4th of July, A Nation Renewed, Plus Interview with Grab a Gun CEO Marc Nemati |TRIGGERED Ep.256
87.2K113 -
 1:06:51
BonginoReport
3 hours agoEpstein: Is It Time To Take Off The Tinfoil Hat? - Nightly Scroll w/ Hayley Caronia (Ep.84)
47.2K119 -
 LIVE
LIVE
RalliedLIVE
6 hours ago $1.62 earnedSHOTTY BOYS vs THE WORLD - WARZONE CHALLENGES
271 watching -
 LIVE
LIVE
The Mike Schwartz Show
5 hours agoTHE MIKE SCHWARTZ SHOW Evening Edition 07-07-2025
4,841 watching -
 LIVE
LIVE
LFA TV
1 day agoLFA TV ALL DAY STREAM - MONDAY 7/7/25
767 watching -
 1:18:05
Kim Iversen
4 hours agoThey Think You’re Stupid: Epstein Case Closed
92.7K93 -

Dr Disrespect
8 hours ago🔴LIVE - DR DISRESPECT - RIDICULOUS WARZONE CHALLENGES
107K8