Risk of Myocarditis in babies exposed to COVID-19 Vaccines | Craig Paardekooper
DESCRIPTION BY CRAIG PAARDEKOOPER
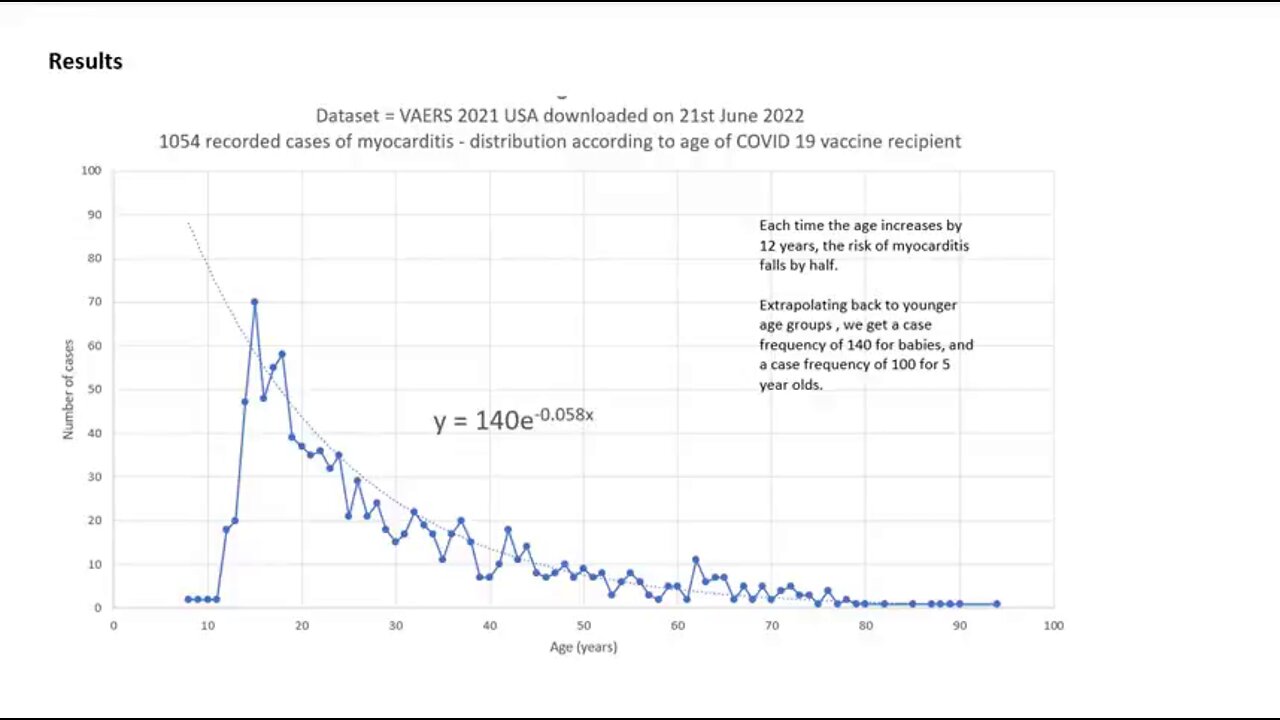
In this study, I downloaded the VAERS data for the whole of 2021, and counted the number of cases where myocarditis was mentioned as a symptom, and the age of each recipient.
There were a total of 1054 cases where the age of the recipient was provided.
Then I created a pivot table to count the number of cases of myocarditis for each age.
The graph shows an exponential decline of myocarditis with age for COVID 19 vaccine recipients. For every 12 years that passes, the risk of myocarditis falls by half.
This means that babies will have –
• 2 x the risk compared to 12 year-olds
• 4 x the risk compared to 24 year-olds
• 8 x the risk compared to 36 year-olds
• 16 x the risk compared to 48 year-olds
It was pointed out that I should take into account the different population sizes for each age group, since if a smaller population produced a high case rate of myocarditis, then this would greatly increase the calculated risk of myocarditis for that population. Since young people had only recently begun vaccination, I suspected that their population was less than older age groups who began vaccination earlier in the year. Consequently, I expected the risk of myocarditis to be even higher in the young than calculated above.
In order to compensate for population size effects, I divided the number of cases for each age group by the total number of records (all adverse reactions) for that age group in VAERS.
The resulting graph shows that the risk of myocarditis starts jumping up to a very high level as age decreases. A very rough approximation is that myocarditis is halved for every 8 years that age increases. But we will need to take a closer look in order to calculate the incidence of myocarditis in babies.
Calculating the Incidence of Myocarditis for Babies
The incidence of myocarditis for babies would be the incidence at year 0, so I would need to extrapolate the graph backwards to see where it cuts the y-axis. As you can see, the graph is shooting up quite rapidly as age decreases, so I decided to create a log graph instead to better estimate the point of intersection.
It looks as if the point of intersection is at 10 3.1217 = 1323. This means that the estimated rate of myocarditis in babies following COVID-19 vaccination is 1323 cases per 100,000 = 7.43 times the rate for 15 year-olds (which was 178 cases per 100,000).
Of course, VAERS is under-reporting by an order of magnitude, but this calculation tells us that babies will get myocarditis 7.43 x more than adolescents.
The Thailand Study
The Thailand myocarditis study (Cardiovascular Effects of the BNT162b2 mRNA COVID-19 Vaccine in Adolescents[v1] | Preprints) found 7 cases of myocarditis in 301 adolescent subjects – a rate of 1 in 43 or 2.3%. Therefore, the incidence of myocarditis in babies will be 7.43 x this = 17%. So 1 in 6 babies exposed to the COVID-19 vaccine will get myocarditis.
You can find my full report at https://t.me/CovidScienceLibrary/868 or at
-
 2:33:37
TimcastIRL
4 hours agoTrump Orders Review of Smithsonian For Being Woke & Out of Control | Timcast IRL
136K47 -
 3:09:10
Barry Cunningham
8 hours agoPRESIDENT TRUMP HAS TAKEN THE MONSTER AWAY FROM THE LEFT! HORROR STORIES WON'T WORK ANYMORE!
57.2K61 -
 1:29:55
WickedVirtue
2 hours agoLate Night Fortnite w/ Friends
13.3K -
 LIVE
LIVE
This is the Ray Gaming
2 hours ago $0.01 earnedCould you be? Would you be? Won't you be my RAYBOR? | Rumble Premium Creator
47 watching -
 1:46:52
JahBlessGames
3 hours ago🎉Come een' and come tru' - VIBES | MUSIC | GAMES
15.1K -
 38:47
38:47
MattMorseTV
5 hours ago $1.10 earned🔴Tulsi just CLEANED HOUSE.🔴
43.7K83 -
 6:24:06
Reolock
6 hours agoWoW Classic Hardcore | WE'RE BACK!!
12.2K1 -
 3:46:13
SynthTrax & DJ Cheezus Livestreams
8 hours agoShell Shock Live - The Scorched Earth Remake/Upgrade - 4pm PST / 7pm EST - RUMBLE GAMING
34.4K -
 2:56:57
Illyes Jr Gaming
4 hours agoBack to Black .....Ops 6 w/ ILLYESJRGAMING
21.3K1 -
 1:07:59
BonginoReport
7 hours agoBoston Mayor Defies Trump, Protects Illegals - Nightly Scroll w/ Hayley Caronia (Ep.115)
121K85