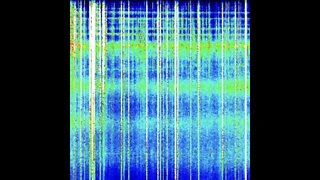
Schumann Resonance Amplitude Spike, Finger of God, No Data, Energy Between Spikes
Schumann Resonance - May 26, 2020 - Amplitudes spiking, Finger of God, Bedrock, Solar Flares influence, Effects on Human Energy Field
Interpretation by Susan Inspired
- Finger of God image
- Amplitude peaks - 72 for Resonance #1 (White)
- The energy between the two spikes
- Other images: green circles, vertice point at ~8
- No data for 2 hours - the importance of ‘two hours’
Please help me make these videos - Paypal.Me: https://paypal.me/SusanInspired?locale.x=en_US Gratitude 🙏
Links -
Schumann Resonance - Finger of God video
https://youtu.be/OvuBsWyViDw
- The Finger of God image in the Schumann data chart
- How the aspects of the chart came together to create this image and my interpretation of what it means and how this energy interacts with our human energy field
Schumann Resonance - No Data What Does it Mean?
https://youtu.be/ZdqQDZeD4ko
Date Range: May 24-26, 2020
Data Source: Schumann Resonance data from Space Observing System, Tomsk, Ru. Solar Flares from Tesis Laboratory of X-Ray Astronomy of the Sun.
Please sign up for my newsletter here - I do a monthly email summarizing my content, plus announcements of courses or events.
http://eepurl.com/cqQ_mH
Check out my blog and more information here:
https://bit.ly/2Qw8Q9F
Video audio and typed notes © 2020 Susan Inspired. All Rights Reserved. Permission is given to share this video on other blogs and websites as long as the author’s credit and live link back to this channel and/or my blog are included.
Thank you for sharing!
May 26 2020
-
 8:44
8:44
SusanInspired
2 years agoSchumann Resonance - Power SPIKES - May 25 2022
27 -
 21:22
21:22
SusanInspired
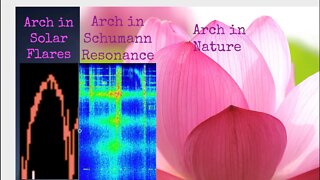
3 years agoSchumann Resonance & Energy July 16 Energy Arch + Solar Flare Arch, Closing Portals of Anger & Fear
29 -
 24:49
24:49
Leak Project
3 years agoSchumann Resonance 1304.85% Increase Today, This is Huge!
7 -
 33:33
33:33
TheSamadhiExperience
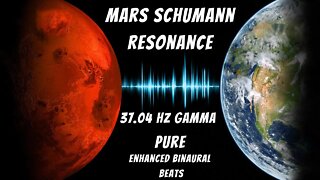
1 year agoMars Schumann Resonance 🪐37.04Hz Enhanced Gamma Waves 🪐 Pure Binaural Beats 🪐Soundings of The Planet
194 -
 2:04
2:04
Worldnewsreporttoday
2 years ago $0.01 earnedSchumann Resonance Spiking March 22nd 2022!
19 -
 5:10
5:10
Worldnewsreporttoday
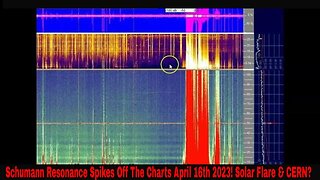
1 year ago $0.02 earnedSchumann Resonance Spikes Off The Charts April 16th 2023! Solar Flare & CERN?
321 -
 2:37
2:37
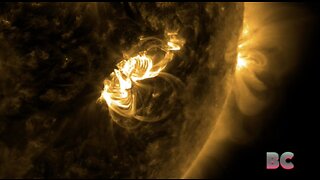
B.C. Begley
1 year agoMysterious ‘heartbeat-like’ radio signals discovered inside a solar flare
51 -
 31:31
31:31
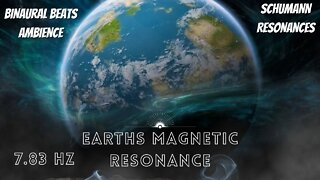
TheSamadhiExperience
1 year agoSchumann Resonance Blackout 🌎 7.83hz Theta 🌎 Biofield tuning 🌎Cosmic unity🌎 Soundings of the Planet
196 -
 11:21
11:21
Age of Discovery
3 years ago $0.19 earnedAi Gauss and the Schumann Resonance - Part 1
1.21K1 -
 33:40
33:40
TheSamadhiExperience
1 year agoMars Schumann Resonance 🪐8.79 Hz Enhanced Alpha Waves 🪐 Pure Binaural Beats 🪐Soundings of The Planet
56