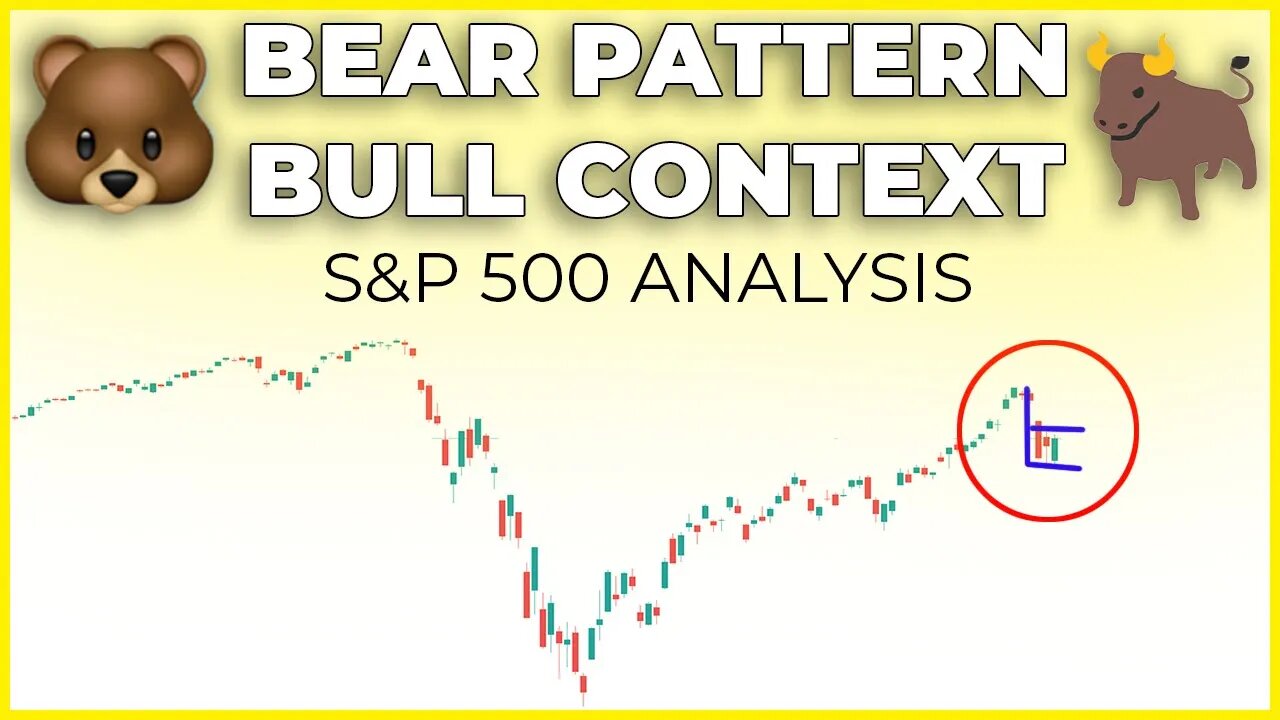
Stock Market Crashing, Gapping & Coiling Into Tight Pattern | S&P 500 Technical Analysis
In today's stock market forecast we look at S&P 500 using technical analysis on multiple time frames. We plot out areas of support, resistance, and patterns that are forming to give us a better idea as to where the stock market might be heading.
The question on everyone's mind is will the stock market crash or will it continue to rise. Unfortunately it's never that easy. We need to look at the stock market (sp500) price action everyday to determine where the price might go.
If I had to guess, the stock market is still fueled by the fed liquidity and an overabundance of new retail investors for the first time in history. I think the price wants to head higher.
However, this is a bearish pattern that is forming on the s&p 500 (bear flag). Keel in mind the context of the chart though! Its in overall bullish context with a pretty big move today from the stock market.
TIMESTAMPS:
Intro: 0:00
SP500 Daily: 01:05
SP500 30 Min: 05:16
MY FAVORITES - https://amz.run/3JLv
○ Book Recommendations
○ My Studio Setup
○ Morning Coffee
STOCK TRADING PLATFORM
○ Webull (GET 2 FREE STOCKS): https://bit.ly/37wobNT
COME SAY HI:
Instagram: https://www.instagram.com/figuringoutmoney
Twitter: https://twitter.com/mikepsilva
Make sure to SUBSCRIBE to my channel!
DISCLAIMER: I am not a professional investment advisor, nor do I claim to be. All my videos are for entertainment and educational purposes only. This is not trading advice. I am wrong all the time. Everything you watch on my channel is my opinion. Links included in this description might be affiliate links. If you purchase a product or service with the links that I provide I may receive a small commission. There is no additional charge to you! Thank you for supporting my channel :)
#SP500 #TechnicalAnalysis
-
 24:50
24:50
Figuring Out Money
2 years ago $0.01 earnedThe Stock Market's Biggest Competitor Is Looking Better And Better.
85 -
 LIVE
LIVE
VapinGamers
43 minutes agoTools of the Trade - EP12 The Art of Story Telling with MidnightinTheMountains - !rumbot !music
287 watching -
 2:05:43
LFA TV
19 hours agoRUMBLE RUNDOWN WEEK 7 with SHAWN FARASH 11.22.25 9AM
115K6 -
 53:25
53:25
X22 Report
3 hours agoMr & Mrs X - Trump Is Using The Same Tactic As Our Founding Fathers To Rebuild America - EP 17
54.9K7 -
 LIVE
LIVE
ttvglamourx
35 minutes agoGLAMOURX VS CALL OF DUTY LOBBIES !DISCORD
103 watching -
 LIVE
LIVE
DannyStreams
2 hours agoSaturday Morning Tarky
123 watching -
 1:12:53
Wendy Bell Radio
6 hours agoPet Talk With The Pet Doc
18.8K19 -
 LIVE
LIVE
CHiLi XDD
42 minutes agoFF7 Remake | Materia Hunting at its finest!
126 watching -
 33:49
33:49
SouthernbelleReacts
19 hours ago $0.99 earnedNOT THE GOPHER 😭🤣 | First Time Watching Caddyshack
7.53K1 -
 26:19
26:19
marcushouse
3 hours ago $4.15 earnedStarship Super Heavy Just Blew Itself Apart! 🤯 What Happened Here!?
12.6K6