SP500 GAP and TRAP (Next stop $3000?) | S&P 500 Technical Analysis
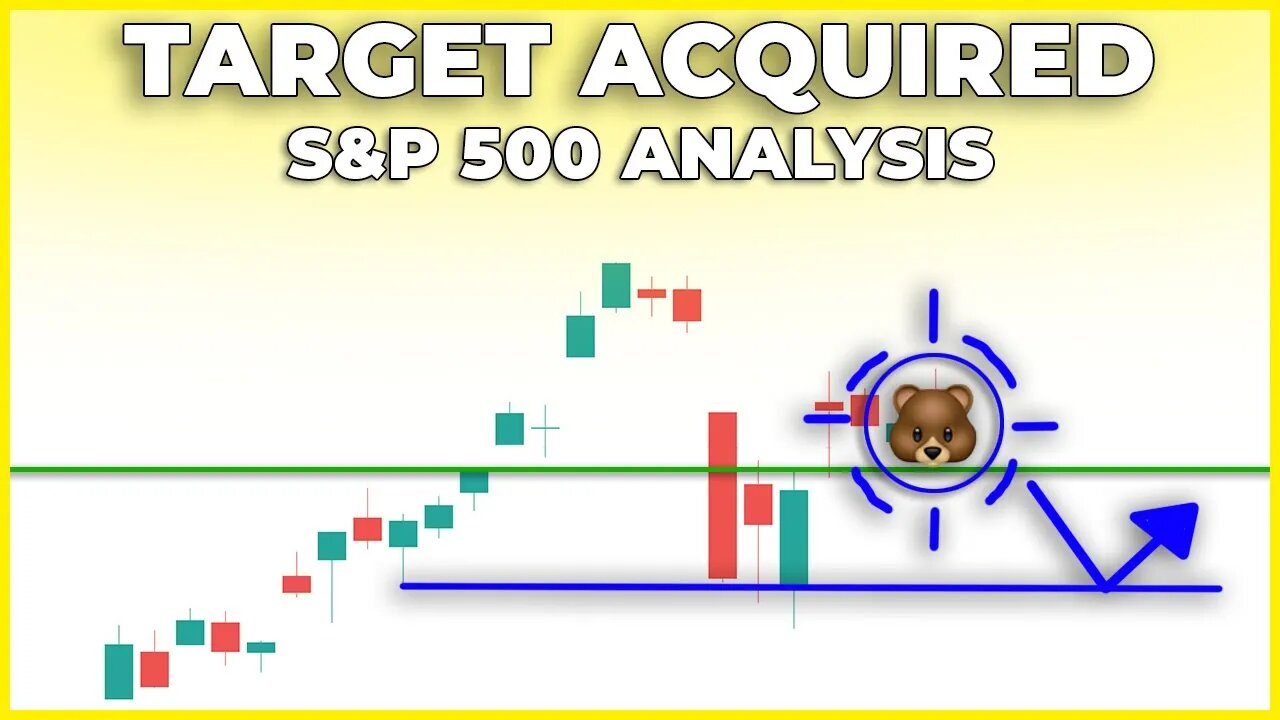
In today's S&P 500 technical analysis review I will cover the gap and trap that took place (bearish engulfing candlestick pattern). I will map out support and resistance levels and walk you through my thought process on trading this stock market volatility.
My overall stock market forecast for the S&P 500 is that the price will pull pack to around $3000 range and that will offer up some major support. If it breaks below that level I will be waiting for a close under $2800 to resume trading again. I personally do not think the Fed will allow for a stock market crash in these current economic conditions. However, who knows at this point :)
TIMESTAMPS
○ Intro: 00:00
○ SP500 Daily: 00:43
○ SPY Instagram Notification: 04:08
○ SP500 Daily Continued: 05:53
○ SP500 30 Minute: 06:15
○ Coco Says Hi: 12:22
MY FAVORITES - https://amz.run/3JLv
○ Book Recommendations
○ My Studio Setup
○ Morning Coffee
STOCK TRADING PLATFORM
○ Webull (GET 2 FREE STOCKS): https://bit.ly/37wobNT
COME SAY HI:
Instagram: https://www.instagram.com/figuringoutmoney
Twitter: https://twitter.com/mikepsilva
Make sure to SUBSCRIBE to my channel!
DISCLAIMER: I am not a professional investment advisor, nor do I claim to be. All my videos are for entertainment and educational purposes only. This is not trading advice. I am wrong all the time. Everything you watch on my channel is my opinion. Links included in this description might be affiliate links. If you purchase a product or service with the links that I provide I may receive a small commission. There is no additional charge to you! Thank you for supporting my channel :)
#SP500 #TechnicalAnalysis
-
 11:07
11:07
Figuring Out Money
1 year agoGet A Closer Look At This Stock Market Rally!
71 -
 LIVE
LIVE
Side Scrollers Podcast
1 hour agoCracker Barrel CANCELS Rebrand + OG YouTuber Has Brain Tumor + More | Side Scrollers IN STUDIO
343 watching -
 LIVE
LIVE
The Mel K Show
1 hour agoMORNINGS WITH MEL K - Reexamining the US relationship with International Banks, Treaties, and NGOs 8-27-25
776 watching -
 LIVE
LIVE
The Shannon Joy Show
3 hours ago🔥🔥SAVE Baby Kit! Hospital Injects 2 Pound Baby With Hep B Vaccine Without Mom’s Consent, Injures Him Severely Then Calls CPS On The Family!🔥🔥
206 watching -
 LIVE
LIVE
Viss
1 hour ago🔴LIVE - Improve Your Battle Royale Play with Tactics & Strategy! - PUBG
145 watching -
 43:26
43:26
Grant Stinchfield
3 hours agoBallot Harvesting Scams EXPOSED: Dead Voters, Fake Signatures, Real Crimes
6.8K1 -
 1:01:40
VINCE
4 hours agoThe Democrats' Ticking Time Bomb | Episode 112 - 08/27/25
173K140 -
 LIVE
LIVE
JuicyJohns
4 hours ago $0.62 earned🟢#1 REBIRTH PLAYER 10.2+ KD🟢
51 watching -
 LIVE
LIVE
LFA TV
6 hours agoLFA TV ALL DAY STREAM - WEDNESDAY 8/27/25
4,783 watching -
 LIVE
LIVE
GloryJean
3 hours agoAggressive Solo Gameplay on Mouse & Keyboard 🖱️ 6.7 K/D
39 watching