SP500 Donkey Pattern (The Feds Inside Joke) | S&P 500 Technical Analysis
In today's S&P 500 Technical Analysis update we review the price action on the daily timeframe and 30 minute candlestick charts.
I will discuss support and resistance levels on the SP500 as well as review any patterns that appear to have formed.
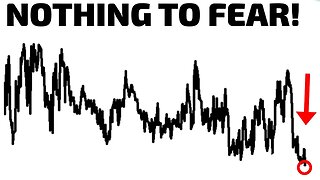
Today formed an evening star pattern on the daily timeframe and broke out of the bull flag we mentioned on previous stock market forecast videos.
The evening star candlestick pattern is a sign of a bearish reversal. I still plan on sitting on the sidelines and waiting patiently for the SP500 to touch the $3000 support range or breakout to to close the window at $3200.
TIMESTAMPS:
Intro: 00:00
SP500 Daily: 00:23
Evening Star Pattern: 00:45
SP500 30 Min: 07:49
Concluding Message: 12:54
Donkey Pattern: 13:18
Coco Burps: 14:11
Shhh : 15:23
Previous S&P 500 Technical Analysis Forecast:
○ https://youtu.be/Z_YxowCMDUk
MY FAVORITES - https://amz.run/3JLv
○ Book Recommendations
○ My Studio Setup
○ Morning Coffee
STOCK TRADING PLATFORM
○ Webull (GET 2 FREE STOCKS): https://bit.ly/37wobNT
COME SAY HI:
Instagram: https://www.instagram.com/figuringoutmoney
Twitter: https://twitter.com/mikepsilva
Make sure to SUBSCRIBE to my channel!
DISCLAIMER: I am not a professional investment advisor, nor do I claim to be. All my videos are for entertainment and educational purposes only. This is not trading advice. I am wrong all the time. Everything you watch on my channel is my opinion. Links included in this description might be affiliate links. If you purchase a product or service with the links that I provide I may receive a small commission. There is no additional charge to you! Thank you for supporting my channel :)
#SP500 #TechnicalAnalysis
-
 23:55
23:55
Figuring Out Money
7 months agoWeird Things Are Happening Right Now
23 -
 1:16:36
Redacted News
4 hours agoHIGH ALERT! WHO'S IN CONTROL OF AMERICA? DEEP STATE MOVING TOWARDS WAR WITH IRAN | Redacted News
87.4K346 -
 2:17:03
Mostly Sports With Mark Titus and Brandon Walker
6 hours agoMostly Sports College Football Dynasty League | Week 2 Session 1
24.7K2 -
 1:01:15
In The Litter Box w/ Jewels & Catturd
21 hours agoKamala Harris Stands With Hamas | In the Litter Box w/ Jewels & Catturd – Ep. 612 – 7/25/2024
71K82 -
 1:10:51
Dr. Drew
8 hours agoDr. Kelly Victory: Paramedic Harry Fisher Witnessed Woman Die IN LINE For Pfizer mRNA... "Second One In Two Weeks" – Ask Dr. Drew
60.8K41 -
 1:26:46
Savanah Hernandez
4 hours agoThe media is already rewriting history for Kamala
39.1K49 -
 1:59:09
Revenge of the Cis
4 hours agoEpisode 1354: Change The Channel
43.9K4 -
 1:57:11
The Quartering
7 hours agoTrump Shooter Social Media FOUND, MSM Claims Trump Never Shot, Mr. Beast Calls Trans Host Disgusting
97.5K89 -
 1:43:27
Tucker Carlson
6 hours agoDr. Ben Carson: The Left’s Worship of Kamala Harris, and God’s Mission for Donald Trump
175K457 -
 2:04:54
Barstool Yak
8 hours agoThe Yak with Big Cat & Co. Presented by Rhoback | The Yak 7-25-24
47.7K