Premium Only Content

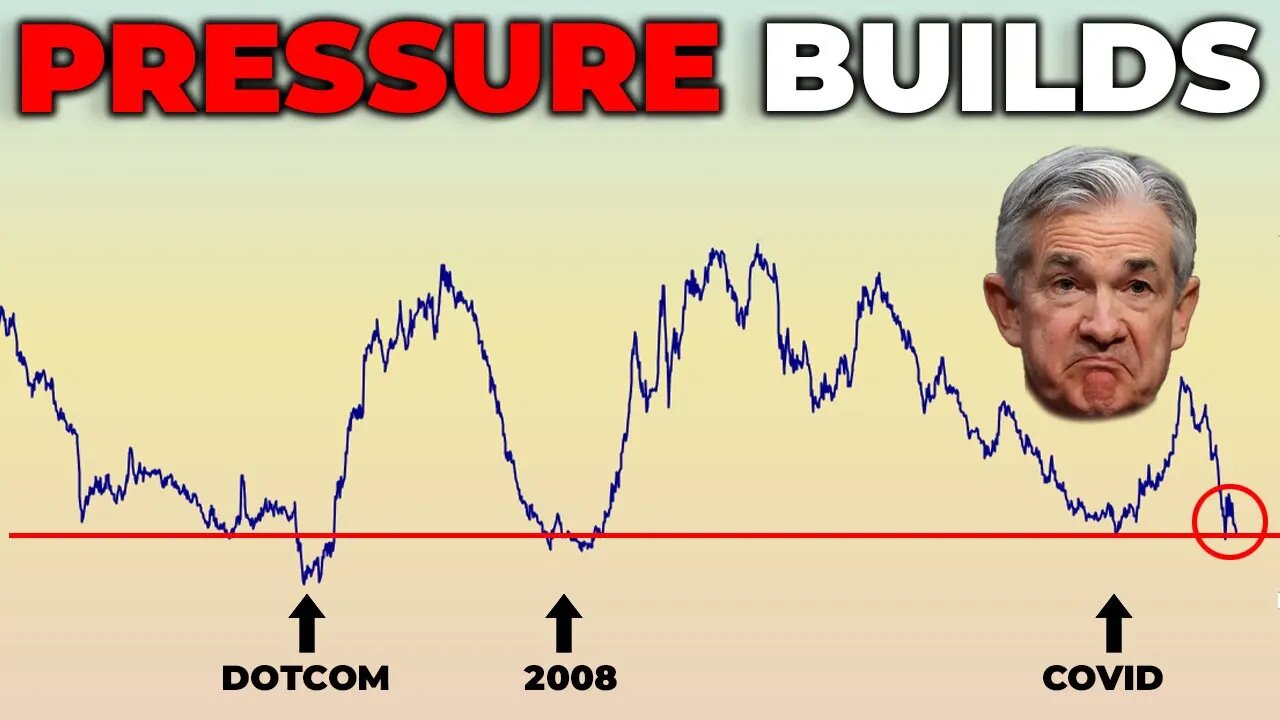
Yield Curves INVERT Again... | Stock Market Analysis
🟢 TRADE IDEAS & DISCORD: https://linktr.ee/figuringoutmoney
🟢 Instagram: https://www.instagram.com/figuringoutmoney
🟢 Twitter: https://twitter.com/mikepsilva
______________________________________________________________________________________________
In today's stock market analysis we discuss the yield curves inverting again and what that means for the S&P 500 and Financials stocks that are about to report earnings.
______________________________________________________________________________________________
How To Predict How Far Stocks Can Go (EXPECTED MOVES):
○ https://youtu.be/JT32L89ZpEk
Saylor To Schiff Bitcoin Indicator:
○ https://youtu.be/zuG9Tjnud9k
Show Me The Money Scan:
○ https://youtu.be/dzRjEuUUb5g
Party Starter Scan:
○ https://youtu.be/zzaN91gcJOI
Bouncy Ball Scan:
○ https://youtu.be/7xKOo6vNaq8
Dark Money Scan:
○ https://youtu.be/ZUMuHaSg1ro
Sleepy Monster Scan:
○ https://youtu.be/C9EQkA7uVU8
High Volatility Scan:
○ https://youtu.be/VC327ko8DfE
______________________________________________________________________________________________
DISCLAIMER: I am not a professional investment advisor, nor do I claim to be. All my videos are for entertainment and educational purposes only. This is not trading advice. I am wrong all the time. Everything you watch on my channel is my opinion. Links included in this description might be affiliate links. If you purchase a product or service with the links that I provide I may receive a small commission. There is no additional charge to you! Thank you for supporting my channel :)
#StockMarket #Markets #SP500
-
 24:50
24:50
Figuring Out Money
1 year ago $0.01 earnedThe Stock Market's Biggest Competitor Is Looking Better And Better.
83 -
 LIVE
LIVE
Redacted News
1 hour agoBREAKING! Another Trump assassination plot foiled? New info in Charlie Kirk's murder | Redacted
19,280 watching -
 LIVE
LIVE
TheCrucible
1 hour agoThe Extravaganza! EP: 56 with Geust co-host Rob Noerr (10/20/25)
1,306 watching -
 LIVE
LIVE
Kim Iversen
2 hours agoTrump EMBARRASSED: Gets Played by Israel AND China
1,142 watching -
 LIVE
LIVE
Side Scrollers Podcast
1 day ago🔴SIDE SCROLLERS FUND-A-THON🔴DAY 1🔴100% REVENUE HELPS CHANGE CULTURE!
829 watching -
 LIVE
LIVE
Tundra Tactical
2 hours agoThe Great Tundra Nation Gaming Stream!!! Featuring ThePiggNation
85 watching -
 LIVE
LIVE
LFA TV
19 hours agoLIVE & BREAKING NEWS! | MONDAY 10/20/25
1,136 watching -
 LIVE
LIVE
freecastle
6 hours agoTAKE UP YOUR CROSS- Depart from evil and DO GOOD; seek PEACE and pursue it.
103 watching -
 1:11:14
vivafrei
3 hours agoAnother Attempt on Trump? False Flag "Right Wing? Fake News? Flawed Ostrich Warrant & MORE!
94.6K31 -
 1:49:23
The Quartering
4 hours agoAttack At Twitchcon, Sniper Nest For Trump Found, Israel BREAKS Ceasefire, Gov't Shutdown To End?
100K58