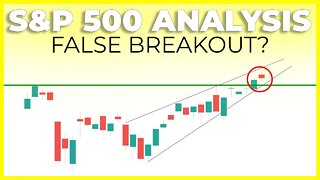
SP500 BULL TRAP WARNING SIGN (Keep An Eye On This Chart) | S&P 500 Technical Analysis
This is the Most important SP500 (S&P 500) Technical Analysis to date. I will be talking about a leading indicator for the S&P 500 that warned us of the stock market crash that took place February 2020, and how that indicator is once again flashing a red warning sign.
The warning sign that i am talking about is the 10yr treasury bond. When there is a divergence between the 2 the 10 yr bond typically give us a head start as to what will take place in the stock market which can help technical traders and investors forecast the current stock market.
By no means is this a end all be all indicator, however when we see this type of spread take place as shown on the FRED chart we typically see the SP500 shortly thereafter follow the 10 yr treasury bonds lead.
PLEASE NOTE: the FRED chart is the 10yr minus the 2 yr government bond. The support line mapped on the candlestick chart is of just the 10 yr bond. Still in my personal opinion is very relevant.
The FRED Chart Comparison:
https://fred.stlouisfed.org/graph/?g=74l2
MY FAVORITES - https://amz.run/3JLv
○ Book Recommendations
○ My Studio Setup
○ Morning Coffee
STOCK TRADING PLATFORM
○ Webull (GET 2 FREE STOCKS): https://bit.ly/37wobNT
COME SAY HI:
Instagram: https://www.instagram.com/figuringoutmoney
Twitter: https://twitter.com/mikepsilva
Make sure to SUBSCRIBE to my channel!
DISCLAIMER: I am not a professional investment advisor, nor do I claim to be. All my videos are for entertainment and educational purposes only. This is not trading advice. I am wrong all the time. Everything you watch on my channel is my opinion. Links included in this description might be affiliate links. If you purchase a product or service with the links that I provide I may receive a small commission. There is no additional charge to you! Thank you for supporting my channel :)
-
 11:49
11:49
Figuring Out Money
3 years agoWARNING: SP500 & VIX Coiling Near Stock Market All Time High (CRASH?) | S&P 500 Technical Analysis
-
 11:52
11:52
Figuring Out Money
4 years agoSP500 FALSE BREAKOUT WARNING SIGN (Stock Market Still In Bullish Context ) | S&P Technical Analysis
-
 9:57
9:57
HueFin News 2 - Stocks
1 year agoSPY Stock Prediction - Expert Sees SP500 Primed For Epic Rise? S&P 500 Stock Analysis
2 -
 21:58
21:58
Matt Kohrs
2 years agoURGENT WARNING: Major Stock Market News ⚠️ || GME, TSLA , TWTR & SPY
2541 -
 11:02
11:02
We Profit with Stock Curry
1 year agoStock Market Technical Analysis - Shocking Indicator!
2415 -
 7:51
7:51
StockTradingTips
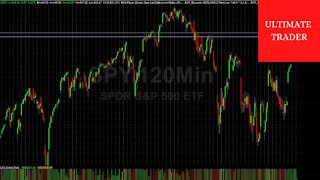
2 years agoBuying the SPDR S&P 500 ETF (August 17th, 2021). Price predictions, signals and chart analysis.
5 -
 12:03
12:03
Matt Kohrs
2 years agoStocks Rip Even Higher 🚀🚀🚀 || AMC, GME, NFLX, SPY & TSLA
133 -
 4:29
4:29
Ultimate Trader
2 years ago $0.01 earnedStocks, SPX, SPY ES Technical Analysis ALERT!
37 -
 9:36
9:36
Top Dog Trading
8 months agoStock Market Warning
1 -
 12:14
12:14
Matt Kohrs
2 years agoAMC, TWTR & SPY (Stock Market Prep July 10th)
1631