
WARNING: SP500 & VIX Coiling Near Stock Market All Time High (CRASH?) | S&P 500 Technical Analysis
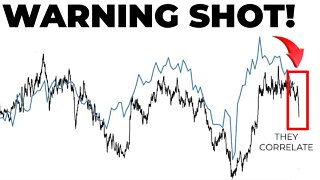
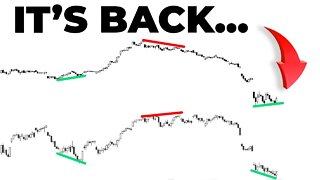
In today's S&P 500 technical analysis video I look over the SP500 and the VIX (S&P 500 Volatility Index). As the stock market is reaching its all time highs the technical pattern that is forming in both the sp500 and the VIX is quite concerning. The SP500 is forming a rising wedge that is bearish, and the volatility index (VIX) is forming a falling wedge that is bullish. These patterns can signal a major pivot is about to take place.
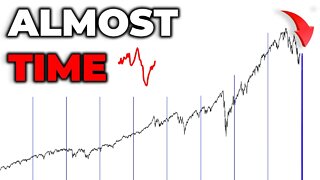
If these technical patterns hold up will we see another 2020 stock market crash? Or will the federal reserve do anything in their power to keep that from happening.
I do these S&P 500 Technical Analysis videos daily so be sure to subscribe to stay ahead of the curve. The stock market is going through some very interesting times and something smells rotten with all of it. I do my best to make these videos easy to understand so that even a beginner can learn from it!
TIMESTAMPS:
Intro: 00:00
SP500 Daily: 00:28
VIX Volatility: 03:14
SP500 Daily: 06:38
SP500 30 Min: 07:25
STOCK TRADING PLATFORM I USE
○ Webull (GET 2 FREE STOCKS): https://bit.ly/3i5U591
MY FAVORITES - https://amz.run/3JLv
○ Book Recommendations
○ My Studio Setup
○ Morning Coffee
COME SAY HI:
Instagram: https://www.instagram.com/figuringoutmoney
Twitter: https://twitter.com/mikepsilva
Make sure to SUBSCRIBE to my channel!
DISCLAIMER: I am not a professional investment advisor, nor do I claim to be. All my videos are for entertainment and educational purposes only. This is not trading advice. I am wrong all the time. Everything you watch on my channel is my opinion. Links included in this description might be affiliate links. If you purchase a product or service with the links that I provide I may receive a small commission. There is no additional charge to you! Thank you for supporting my channel :)
-
 20:11
20:11
Figuring Out Money
2 years ago $0.01 earnedLet's Get Ready To Rumble!
36 -
 0:59
0:59
Figuring Out Money
3 years agoSome Of My Favorite Stock Market Books | Technical Analysis
8 -
 15:30
15:30
Figuring Out Money
3 years agoMORE Economic Warning Signs Continue To Build | Stock Market Analysis
13 -
 25:46
25:46
Figuring Out Money
3 years agoIS IT TIME...? | Stock Market Analysis
26 -
 1:15
1:15
The Options Option
3 years agoStock Market Analysis for Crypto Price Prediction | Technical Rally #stocks #cryptocurrency
35 -
 17:35
17:35
Figuring Out Money
3 years ago $0.13 earnedBEAR MARKETS BOUNCE | Stock Market Analysis
9997 -
 7:02
7:02
Figuring Out Money
3 years agoSP500 Tends Do *THIS* In The Middle Of JUNE | Stock Market Analysis
4 -
 6:06
6:06
Brian Shannon
3 years agoStock Market Analysis 1/13/22
81 -
 15:39
15:39
Figuring Out Money
3 years agoWATCH AND LEARN | Stock Market Analysis
25 -
 39:44
39:44
Figuring Out Money
3 years agoHow To Outperform The S&P 500 IN 2022 | Stock Market Analysis
7