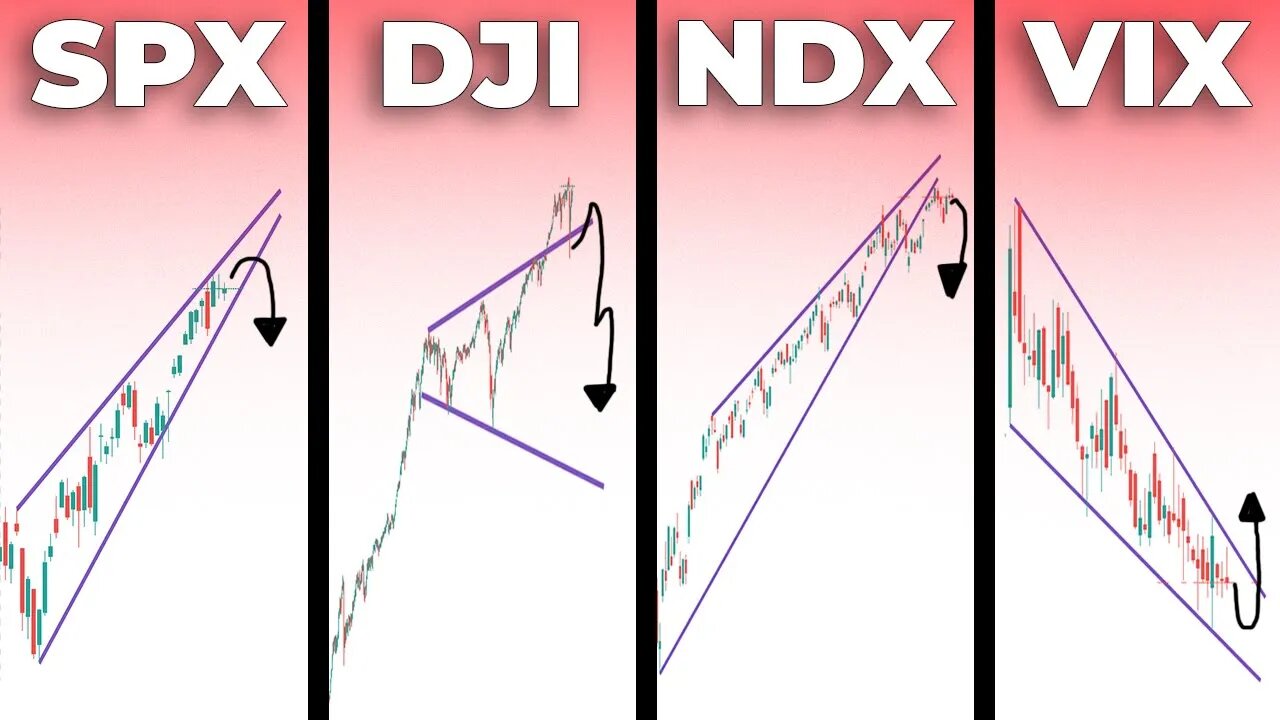
😰HMMM...WILL HISTORY REPEAT? | Stock Market Technical Analysis (SP500, Dow Jones, Nasdaq 100, VIX)
In today's Stock Market Technical Analysis, we go over historic patterns to determine if history will repeat itself, and prove that this stock market has been in a MASSIVE Bull trap.
We look at the technical charts of the SP500, Dow Jones Industrial Average, Nasdaq 100, and the Volatility Index for the S&P 500.
Each of these indexes has historic technical patterns that I will uncover. If history chooses to repeat itself, this can lead to a MASSIVE Stock Market Crash in 2020.
TIMESTAMPS:
Intro: 00:00
SP500 DAILY: 00:37
VIX DAILY: 02:18
NASDAQ 100 DAILY: 04:35
DOW JONES DAILY: 05:56
SP500 DAILY: 08:29
Nasdaq 100 Technical Analysis:
https://youtu.be/1dm0KyuCjn4
STOCK TRADING PLATFORM I USE
○ Webull (GET 2 FREE STOCKS): https://bit.ly/3i5U591
MY FAVORITES - https://amz.run/3JLv
○ Book Recommendations
○ My Studio Setup
○ Morning Coffee
COME SAY HI:
Instagram: https://www.instagram.com/figuringoutmoney
Twitter: https://twitter.com/mikepsilva
Make sure to SUBSCRIBE to my channel!
DISCLAIMER: I am not a professional investment advisor, nor do I claim to be. All my videos are for entertainment and educational purposes only. This is not trading advice. I am wrong all the time. Everything you watch on my channel is my opinion. Links included in this description might be affiliate links. If you purchase a product or service with the links that I provide I may receive a small commission. There is no additional charge to you! Thank you for supporting my channel :)
#StockMarket #TechnicalAnalysis
-
 11:07
11:07
Figuring Out Money
2 years ago $0.01 earnedGet A Closer Look At This Stock Market Rally!
82 -
 0:59
0:59
Figuring Out Money
3 years agoSome Of My Favorite Stock Market Books | Technical Analysis
8 -
 1:15
1:15
The Options Option
3 years agoStock Market Analysis for Crypto Price Prediction | Technical Rally #stocks #cryptocurrency
35 -
 17:35
17:35
Figuring Out Money
3 years ago $0.13 earnedBEAR MARKETS BOUNCE | Stock Market Analysis
9977 -
 3:43
3:43
Muathe.com
3 years agoStock Market / Dow Jones / Price Manipulation?
47 -
 6:06
6:06
Brian Shannon
3 years agoStock Market Analysis 1/13/22
81 -
 15:39
15:39
Figuring Out Money
3 years agoWATCH AND LEARN | Stock Market Analysis
25 -
 17:22
17:22
The SPX Investing Program
4 years ago $0.01 earnedFree Stock Market Course Part 33: Technical Analysis
118 -
 25:46
25:46
Figuring Out Money
3 years agoIS IT TIME...? | Stock Market Analysis
26 -
 19:15
19:15
Figuring Out Money
3 years agoWe've Been Here Before! | Stock Market Analysis
17