STOCK MARKET SENTIMENT IS BULLISH (Maybe Not For Long)
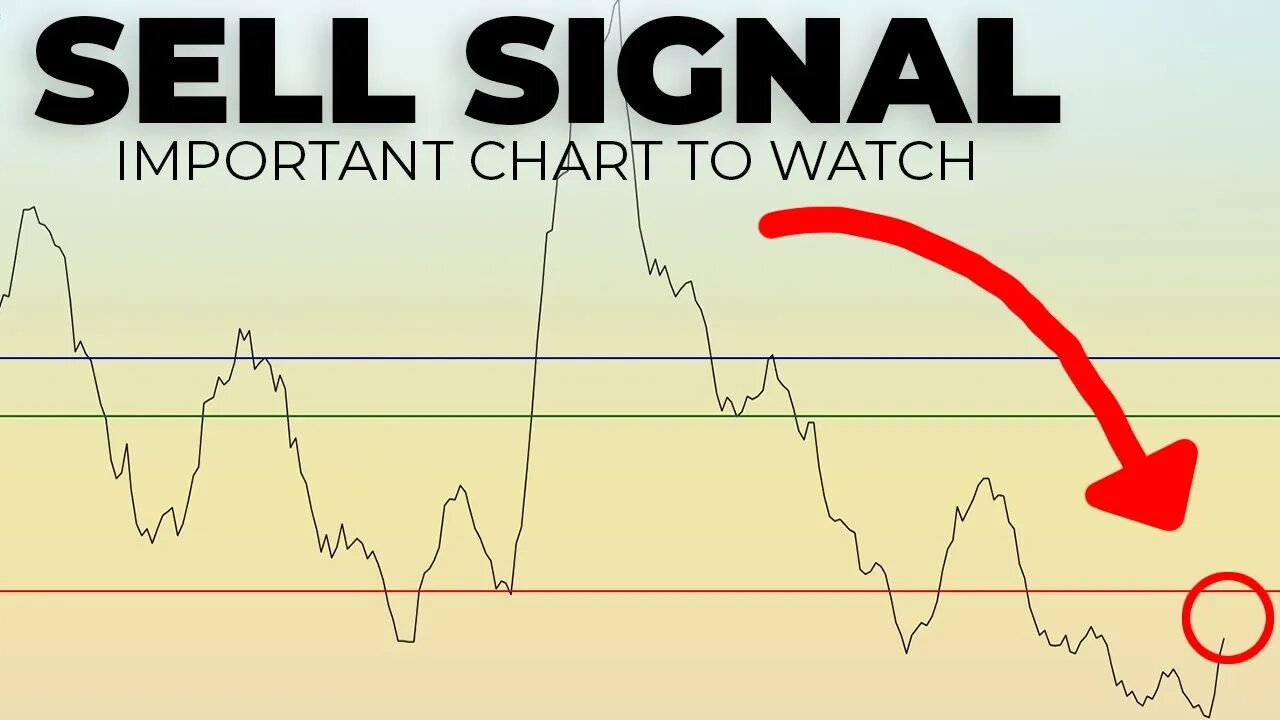
In today's Stock Market Brief of the financial markets we use technical analysis to review the SP500, VIX Volatility Index, Nasdaq 100, and the DXY Dollar Index. I will also be showing you a very important chart that can help show when a good time to sell and buy into market momentum. This chart is known as the $CPC Options Put/Call Ratio.
The $CPC when smoothed out with a 10 period moving average, it acts as a good indicator to determine if the stock market is going to be pulling back, or if it's going to go higher.
I walk you through this chart so that even a beginner investor in the stock can make sence of it.
TIMESTAMPS:
Intro: 00:00
$CPCE Options Equity: 00:47
$CPC Options Put/Call Ratio Chart: 02:27
SP500 Analysis: 12:30
VIX Volatility Index: 16:58
NDX Nasdaq 100 Analysis: 19:04
Michael's Rant: 20:49
DXY Dollar Index Analysis: 23:38
STOCK TRADING PLATFORM I USE
○ Webull (GET 2 FREE STOCKS): https://bit.ly/3i5U591
MY FAVORITES - https://amz.run/3JLv
○ Book Recommendations
○ My Studio Setup
○ Morning Coffee
COME SAY HI:
Instagram: https://www.instagram.com/figuringoutmoney
Twitter: https://twitter.com/mikepsilva
Make sure to SUBSCRIBE to my channel!
DISCLAIMER: I am not a professional investment advisor, nor do I claim to be. All my videos are for entertainment and educational purposes only. This is not trading advice. I am wrong all the time. Everything you watch on my channel is my opinion. Links included in this description might be affiliate links. If you purchase a product or service with the links that I provide I may receive a small commission. There is no additional charge to you! Thank you for supporting my channel :)
-
 24:50
24:50
Figuring Out Money
2 years ago $0.01 earnedThe Stock Market's Biggest Competitor Is Looking Better And Better.
85 -
 1:57:07
Steven Crowder
4 hours agoEpstein Release Watch: What Happens When Trump Signs
401K265 -
 56:05
56:05
The Rubin Report
3 hours agoDems Regret Epstein Files Release as Major Dem Names Come Out
34.2K102 -
 LIVE
LIVE
LFA TV
17 hours agoLIVE & BREAKING NEWS! | WEDNESDAY 11/19/25
2,221 watching -
 LIVE
LIVE
The Shannon Joy Show
3 hours ago“Quiet Piggy!” Trump Lashes Out At Reporter After Epstein Bill Passes Overwhelmingly In House!
182 watching -
 53:56
53:56
Grant Stinchfield
2 hours ago $1.05 earnedDOJ’s Salacious Distraction: The REAL Epstein Intel Is Locked in Langley!
10K4 -
 3:18:33
LadyDesireeMusic
4 hours ago $1.32 earnedLive Piano Music & Convo & Requests
13.7K1 -
 59:16
59:16
Trumpet Daily
2 hours ago $1.35 earnedTrumpet Daily LIVE | Nov. 19, 2025
6.64K -
 LIVE
LIVE
Viss
4 hours ago🔴LIVE - Pushing The Timer and Those in Our Path - Arc Raiders
159 watching -
 58:42
58:42
Daniel Davis Deep Dive
5 hours agoU.S. Missile Defense Deception /MIT Professor Ted Postol
4.68K4