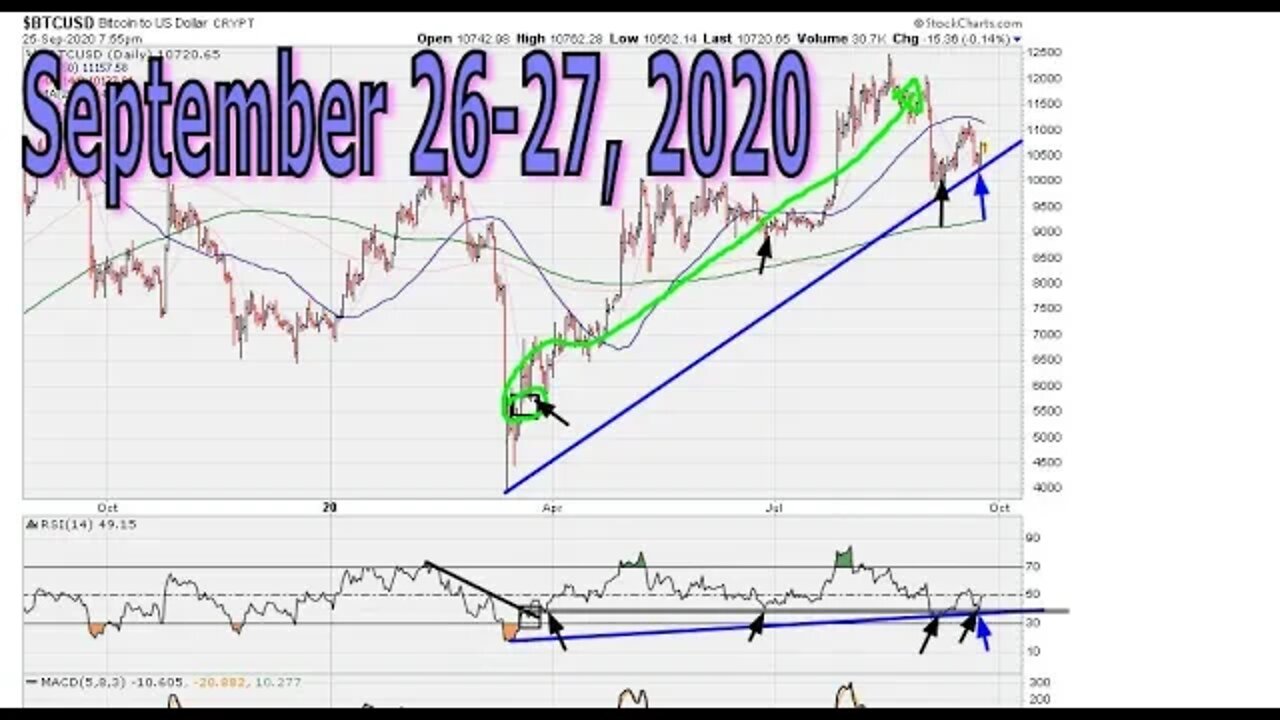
Weekend Market Chart Analysis - September 26-27, 2020
4 years ago
1
Charts discussed include: NASDAQ weekly 10,617.44, NASDAQ daily, NASDAQ 4-hourly, SPX daily, GLD daily, GLD 4-hourly, $WTIC daily, $XLE daily below RSI 30.9, VT daily, EFA daily, EEM daily, $TSX daily, $NIFTY daily, and BTCUSD daily.
Loading comments...
-
 19:54
19:54
Muathe.com
1 year ago $0.02 earned🟢 MAJOR Bear Market Has Began!? Stocks, Crypto
94 -
 13:54
13:54
Mama to Five
14 hours ago $0.64 earnedWHAT I EAT IN A DAY! | FULL DAY OF MEALS AS A MOM OF 5
11.1K4 -
 1:01:18
Futures Edge: Finance Unfiltered with Jim Iuorio and Bob Iaccino
1 day ago $10.10 earnedLIVE Technical Analysis with Mike Arnold
60.9K2 -
 4:56
4:56
SLS - Street League Skateboarding
6 days agoDay in the Life of Pro Skateboarder Mariah Duran | Part 2
14.1K1 -
 14:32
14:32
Chubbyemu
2 days agoA Woman Drank 1 Liter Soy Sauce Colon Cleanse In 2 Hours. This Is What Happened To Her Brain.
25.9K12 -
 2:57:55
FreshandFit
5 hours agoAfter Hours w/ Girls
76.1K30 -
 22:23
22:23
Neil McCoy-Ward
15 hours agoThe Middle Class Just Collapsed...
17.9K7 -
 15:04
15:04
IsaacButterfield
23 hours ago $2.43 earnedThe Most Insane People My Algorithm Keeps Throwing at Me
15.1K4 -
 11:31
11:31
China Uncensored
16 hours agoTop 5 Countries That Sold Out to China
21.5K15 -
 5:14
5:14
BIG NEM
8 hours agoHe Drank the Forbidden Balkan Libido Potion… Mistake.
15.2K2